 Inheritance diagram for PHPlot:
 Collaboration diagram for PHPlot:
Public Member Functions | |
| PHPlot ($which_width=600, $which_height=400, $which_output_file=NULL, $which_input_file=NULL) | |
| GetImage ($image_filename, &$width, &$height) | |
| SetInputFile ($which_input_file) | |
| SetIndexColor ($which_color) | |
| SetIndexDarkColor ($which_color) | |
| SetDefaultStyles () | |
| SetBackgroundColor ($which_color) | |
| SetPlotBgColor ($which_color) | |
| SetTitleColor ($which_color) | |
| SetTickColor ($which_color) | |
| SetLabelColor ($which_color) | |
| SetTextColor ($which_color) | |
| SetLightGridColor ($which_color) | |
| SetGridColor ($which_color) | |
| SetImageBorderColor ($which_color) | |
| SetTransparentColor ($which_color) | |
| SetRGBArray ($which_color_array) | |
| SetRGBColor ($color_asked) | |
| SetDataColors ($which_data=NULL, $which_border=NULL) | |
| SetDataBorderColors ($which_br=NULL) | |
| SetErrorBarColors ($which_err=NULL) | |
| SetDefaultDashedStyle ($which_style) | |
| SetDashedStyle ($which_ndxcol) | |
| SetLineWidths ($which_lw=NULL) | |
| SetLineStyles ($which_ls=NULL) | |
| SetLineSpacing ($which_spc) | |
| SetUseTTF ($which_ttf) | |
| SetTTFPath ($which_path) | |
| SetDefaultTTFont ($which_font) | |
| SetDefaultFonts () | |
| SetFont ($which_elem, $which_font, $which_size=12) | |
| ProcessTextGD ($draw_it, $font_number, $font_width, $font_height, $angle, $x, $y, $color, $text, $h_factor, $v_factor) | |
| ProcessTextTTF ($draw_it, $font_file, $font_size, $angle, $x, $y, $color, $text, $h_factor, $v_factor) | |
| ProcessText ($draw_it, $font, $angle, $x, $y, $color, $text, $halign, $valign) | |
| DrawText ($which_font, $which_angle, $which_xpos, $which_ypos, $which_color, $which_text, $which_halign='left', $which_valign='bottom') | |
| SizeText ($which_font, $which_angle, $which_text) | |
| SetFileFormat ($format) | |
| SetBgImage ($input_file, $mode='centeredtile') | |
| SetPlotAreaBgImage ($input_file, $mode='tile') | |
| SetOutputFile ($which_output_file) | |
| SetIsInline ($which_ii) | |
| PrintImage () | |
| PrintError ($error_message) | |
| DrawError ($error_message, $where_x=NULL, $where_y=NULL) | |
| SetXDataLabelPos ($which_xdlp) | |
| SetYDataLabelPos ($which_ydlp, $which_distance_from_point=0) | |
| SetXTickLabelPos ($which_xtlp) | |
| SetYTickLabelPos ($which_ytlp) | |
| SetXLabelType ($which_xlt) | |
| SetYLabelType ($which_ylt) | |
| SetXTimeFormat ($which_xtf) | |
| SetYTimeFormat ($which_ytf) | |
| SetNumberFormat ($decimal_point, $thousands_sep) | |
| SetXLabelAngle ($which_xla) | |
| SetYLabelAngle ($which_yla) | |
| CheckOption ($which_opt, $which_acc, $which_func) | |
| SetBrowserCache ($which_browser_cache) | |
| SetPrintImage ($which_pi) | |
| SetLegend ($which_leg) | |
| SetLegendPixels ($which_x, $which_y) | |
| SetLegendWorld ($which_x, $which_y) | |
| SetLegendStyle ($text_align, $colorbox_align='', $style='') | |
| SetPlotBorderType ($pbt) | |
| SetImageBorderType ($sibt) | |
| SetDrawPlotAreaBackground ($dpab) | |
| SetDrawYGrid ($dyg) | |
| SetDrawXGrid ($dxg) | |
| SetDrawDashedGrid ($ddg) | |
| SetDrawXDataLabelLines ($dxdl) | |
| SetDrawYDataLabelLines ($dydl) | |
| SetTitle ($which_title) | |
| SetXTitle ($which_xtitle, $which_xpos='plotdown') | |
| SetYTitle ($which_ytitle, $which_ypos='plotleft') | |
| SetShading ($which_s) | |
| SetPlotType ($which_pt) | |
| SetYAxisPosition ($pos) | |
| SetXAxisPosition ($pos) | |
| SetXScaleType ($which_xst) | |
| SetYScaleType ($which_yst) | |
| SetPrecisionX ($which_prec) | |
| SetPrecisionY ($which_prec) | |
| SetErrorBarLineWidth ($which_seblw) | |
| SetLabelScalePosition ($which_blp) | |
| SetErrorBarSize ($which_ebs) | |
| SetErrorBarShape ($which_ebs) | |
| SetPointShapes ($which_pt) | |
| SetPointSizes ($which_ps) | |
| SetDrawBrokenLines ($bl) | |
| SetDataType ($which_dt) | |
| SetDataValues (&$which_dv) | |
| PadArrays () | |
| pad_array (&$arr, $size) | |
| number_format ($number, $decimals=0) | |
| SetCallback ($reason, $function, $arg=NULL) | |
| GetCallback ($reason) | |
| RemoveCallback ($reason) | |
| DoCallback () # Note | |
| FindDataLimits () | |
| CalcMargins ($maximize) | |
| CalcPlotAreaPixels () | |
| SetMarginsPixels ($which_lm, $which_rm, $which_tm, $which_bm) | |
| SetPlotAreaPixels ($x1, $y1, $x2, $y2) | |
| CalcPlotAreaWorld () | |
| SetPlotAreaWorld ($xmin=NULL, $ymin=NULL, $xmax=NULL, $ymax=NULL) | |
| CalcBarWidths () | |
| CalcAxisPositions () | |
| CalcTranslation () | |
| xtr ($x_world) | |
| ytr ($y_world) | |
| CalcTicks ($which) | |
| CalcMaxTickLabelSize ($which) | |
| CalcMaxDataLabelSize () | |
| FormatLabel ($which_pos, $which_lab) | |
| SetXTickIncrement ($which_ti='') | |
| SetYTickIncrement ($which_ti='') | |
| SetNumXTicks ($which_nt) | |
| SetNumYTicks ($which_nt) | |
| SetYTickPos ($which_tp) | |
| SetXTickPos ($which_tp) | |
| SetSkipTopTick ($skip) | |
| SetSkipBottomTick ($skip) | |
| SetSkipLeftTick ($skip) | |
| SetSkipRightTick ($skip) | |
| SetXTickLength ($which_xln) | |
| SetYTickLength ($which_yln) | |
| SetXTickCrossing ($which_xc) | |
| SetYTickCrossing ($which_yc) | |
| DrawBackground () | |
| DrawPlotAreaBackground () | |
| tile_img ($file, $xorig, $yorig, $width, $height, $mode) | |
| DrawImageBorder () | |
| DrawTitle () | |
| DrawXTitle () | |
| DrawYTitle () | |
| DrawYAxis () | |
| DrawXAxis () | |
| DrawYTick ($which_ylab, $which_ypix) | |
| DrawYTicks () | |
| DrawXTick ($which_xlab, $which_xpix) | |
| DrawXTicks () | |
| DrawPlotBorder () | |
| DrawDataLabel ($which_font, $which_angle, $x_world, $y_world, $which_color, $which_text, $which_halign='center', $which_valign='bottom', $x_adjustment=0, $y_adjustment=0) | |
| DrawXDataLabel ($xlab, $xpos, $row=FALSE) | |
| DrawXDataLine ($xpos, $row) | |
| DrawLegend () | |
| DrawAxisLegend () | |
| DrawPieChart () | |
| DrawDotsError () | |
| DrawDots () | |
| DrawThinBarLines () | |
| DrawYErrorBar ($x_world, $y_world, $error_height, $error_bar_type, $color) | |
| DrawDot ($x_world, $y_world, $record, $color) | |
| DrawArea () | |
| DrawLines () | |
| DrawLinesError () | |
| DrawSquared () | |
| DrawBars () | |
| DrawStackedBars () | |
| DrawGraph () | |
| SetDrawVertTicks ($which_dvt) | |
| SetDrawHorizTicks ($which_dht) | |
| SetNumHorizTicks ($n) | |
| SetNumVertTicks ($n) | |
| SetHorizTickIncrement ($inc) | |
| SetVertTickIncrement ($inc) | |
| SetVertTickPosition ($which_tp) | |
| SetHorizTickPosition ($which_tp) | |
| SetTitleFontSize ($which_size) | |
| SetAxisFontSize ($which_size) | |
| SetSmallFontSize ($which_size) | |
| SetXLabelFontSize ($which_size) | |
| SetYLabelFontSize ($which_size) | |
| SetXLabel ($which_xlab) | |
| SetYLabel ($which_ylab) | |
| SetTickLength ($which_tl) | |
| SetYGridLabelType ($which_yglt) | |
| SetXGridLabelType ($which_xglt) | |
| SetYGridLabelPos ($which_yglp) | |
| SetXGridLabelPos ($which_xglp) | |
| SetXTitlePos ($xpos) | |
| SetYTitlePos ($xpos) | |
| SetXDataLabelAngle ($which_xdla) | |
| SetDrawXDataLabels ($which_dxdl) | |
| SetNewPlotAreaPixels ($x1, $y1, $x2, $y2) | |
| SetColor ($which_color) | |
| SetLineWidth ($which_lw) | |
| SetPointShape ($which_pt) | |
| SetPointSize ($which_ps) | |
Detailed Description
Definition at line 23 of file phplot.php.
Member Function Documentation
◆ CalcAxisPositions()
| PHPlot::CalcAxisPositions | ( | ) |
Definition at line 2832 of file phplot.php.
References DoCallback(), and GetCallback().
Referenced by DrawGraph().
Here is the call graph for this function: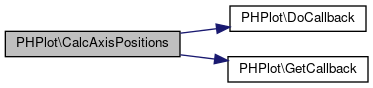 Here is the caller graph for this function:
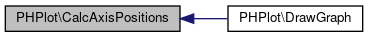
◆ CalcBarWidths()
| PHPlot::CalcBarWidths | ( | ) |
For bar plots, which have equally spaced x variables.
Definition at line 2785 of file phplot.php.
References $bar_extra_space, and $bar_width_adjust.
Referenced by DrawGraph().
Here is the caller graph for this function:
◆ CalcMargins()
| PHPlot::CalcMargins | ( | $maximize | ) |
Calculates image margins on the fly from title positions and sizes, and tick labels positions and sizes.
TODO: add x_tick_label_width and y_tick_label_height and use them to calculate max_x_labels and max_y_labels, to be used by drawing functions to avoid overlapping.
A picture of the locations of elements and spacing can be found in the PHPlot Reference Manual.
Calculates the following (class variables unless noted):
Plot area margins (see note below): y_top_margin y_bot_margin x_left_margin x_right_margin
Title sizes (these are now local, not class variables, since they are not used elsewhere): title_height : Height of main title x_title_height : Height of X axis title, 0 if no X title y_title_width : Width of Y axis title, 0 if no Y title
Tick/Data label offsets, relative to plot_area: x_label_top_offset, x_label_bot_offset, x_label_axis_offset y_label_left_offset, y_label_right_offset, y_label_axis_offset
Title offsets, relative to plot area: x_title_top_offset, x_title_bot_offset y_title_left_offset, y_title_left_offset
Note: The margins are calculated, but not stored, if margins or plot area were set by the user with SetPlotAreaPixels or SetMarginsPixels (as indicated by the plot_margins_set flag). The margin calculation is mixed in with the offset variables, so it doesn't see worth the trouble to separate them.
If the $maximize argument is true, we use the full image size, minus safe_margin and main title, for the plot. This is for pie charts which have no axes or X/Y titles.
Definition at line 2419 of file phplot.php.
References $safe_margin, $x_data_label_pos, $x_tick_label_pos, $x_tick_length, $x_tick_pos, $x_title_pos, $y_tick_label_pos, $y_tick_length, $y_tick_pos, $y_title_pos, CalcMaxDataLabelSize(), CalcMaxTickLabelSize(), DoCallback(), GetCallback(), and SizeText().
Referenced by DrawGraph().
Here is the call graph for this function: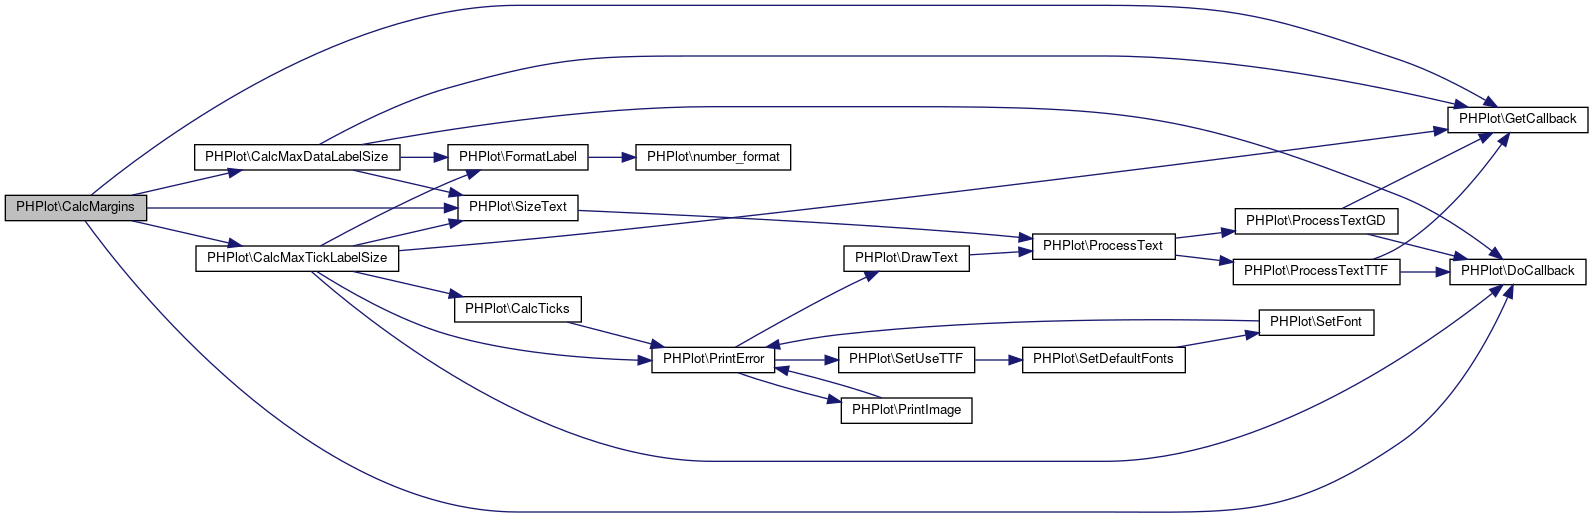 Here is the caller graph for this function:
◆ CalcMaxDataLabelSize()
| PHPlot::CalcMaxDataLabelSize | ( | ) |
Definition at line 3049 of file phplot.php.
References $x_label_angle, DoCallback(), FormatLabel(), GetCallback(), and SizeText().
Referenced by CalcMargins().
Here is the call graph for this function: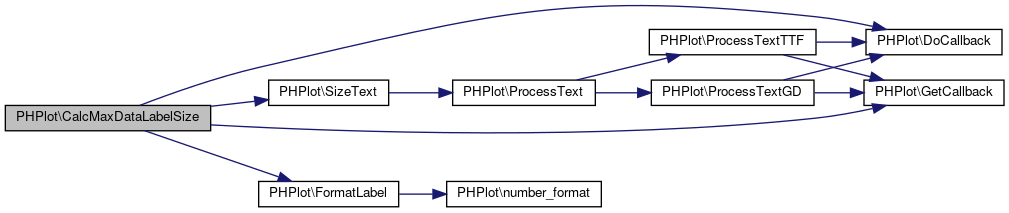 Here is the caller graph for this function:
◆ CalcMaxTickLabelSize()
| PHPlot::CalcMaxTickLabelSize | ( | $which | ) |
Definition at line 3009 of file phplot.php.
References $x_label_angle, $y_label_angle, CalcTicks(), DoCallback(), FormatLabel(), GetCallback(), PrintError(), and SizeText().
Referenced by CalcMargins().
Here is the call graph for this function: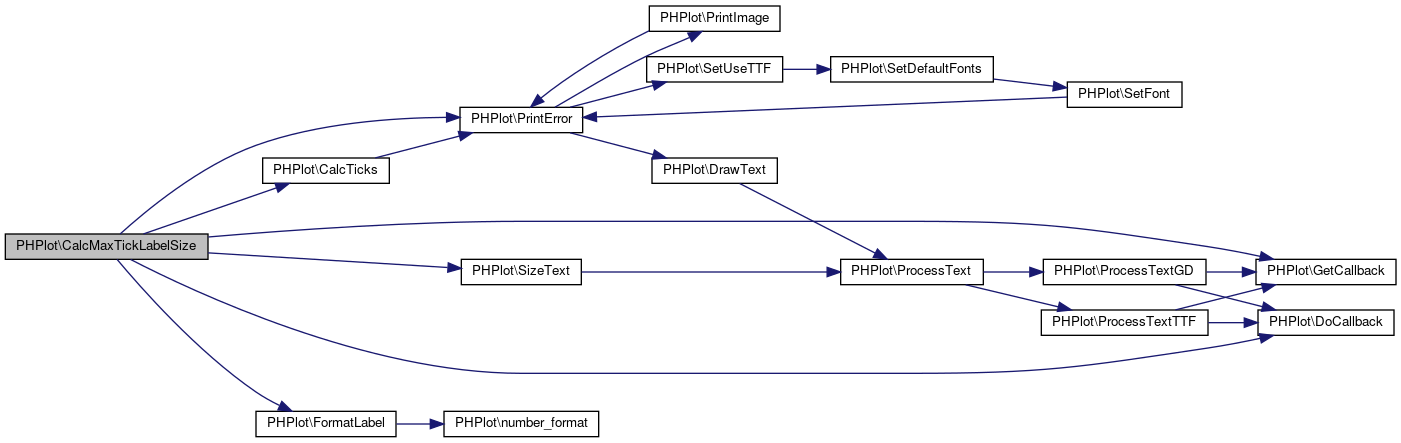 Here is the caller graph for this function:
◆ CalcPlotAreaPixels()
| PHPlot::CalcPlotAreaPixels | ( | ) |
Definition at line 2647 of file phplot.php.
References DoCallback().
Referenced by DrawGraph().
Here is the call graph for this function: Here is the caller graph for this function:
◆ CalcPlotAreaWorld()
| PHPlot::CalcPlotAreaWorld | ( | ) |
Definition at line 2707 of file phplot.php.
References DoCallback(), GetCallback(), and PrintError().
Referenced by DrawGraph().
Here is the call graph for this function: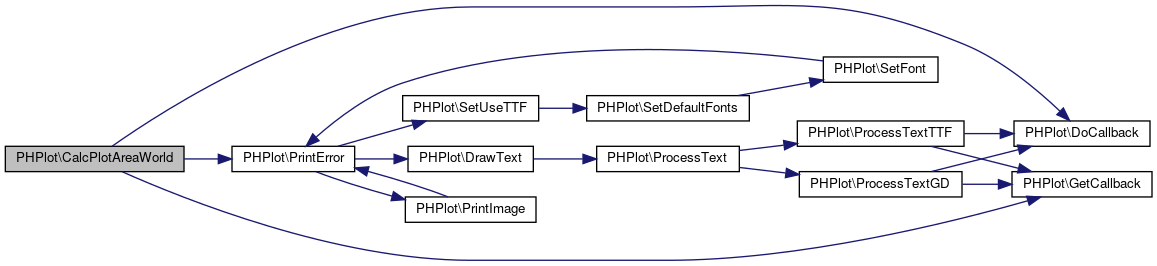 Here is the caller graph for this function:
◆ CalcTicks()
| PHPlot::CalcTicks | ( | $which | ) |
Definition at line 2957 of file phplot.php.
References $num_x_ticks, $num_y_ticks, $skip_bottom_tick, $skip_left_tick, $skip_right_tick, $skip_top_tick, $x_tick_inc, $y_tick_inc, and PrintError().
Referenced by CalcMaxTickLabelSize(), DrawXTicks(), and DrawYTicks().
Here is the call graph for this function: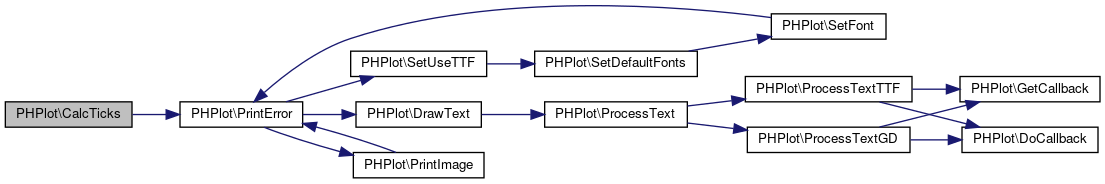 Here is the caller graph for this function:
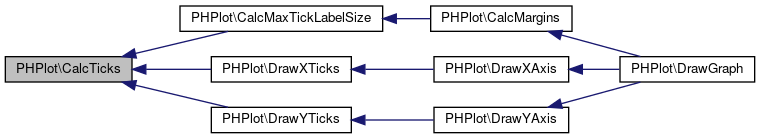
◆ CalcTranslation()
| PHPlot::CalcTranslation | ( | ) |
Calculates scaling stuff...
Definition at line 2866 of file phplot.php.
References DoCallback(), GetCallback(), xtr(), and ytr().
Referenced by DrawGraph(), and SetNewPlotAreaPixels().
Here is the call graph for this function: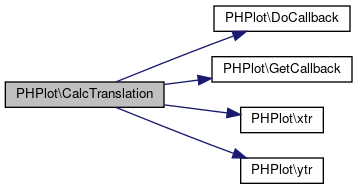 Here is the caller graph for this function:
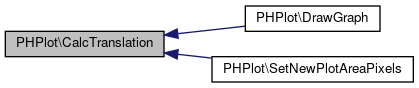
◆ CheckOption()
| PHPlot::CheckOption | ( | $which_opt, | |
| $which_acc, | |||
| $which_func | |||
| ) |
Checks the valididy of an option. $which_opt String to check, such as the provided value of a function argument. $which_acc String of accepted choices. Must be lower-case, and separated by exactly ', ' (comma, space). $which_func Name of the calling function, for error messages. Returns the supplied option value, downcased and trimmed, if it is valid. Reports an error if the supplied option is not valid.
Definition at line 1683 of file phplot.php.
References PrintError().
Referenced by DrawDots(), DrawThinBarLines(), SetBgImage(), SetDataType(), SetErrorBarShape(), SetFileFormat(), SetImageBorderType(), SetLegendStyle(), SetPlotAreaBgImage(), SetPlotBorderType(), SetPlotType(), SetPointShapes(), SetXDataLabelPos(), SetXLabelType(), SetXScaleType(), SetXTickLabelPos(), SetXTickPos(), SetXTitle(), SetYDataLabelPos(), SetYLabelType(), SetYScaleType(), SetYTickLabelPos(), SetYTickPos(), and SetYTitle().
Here is the call graph for this function: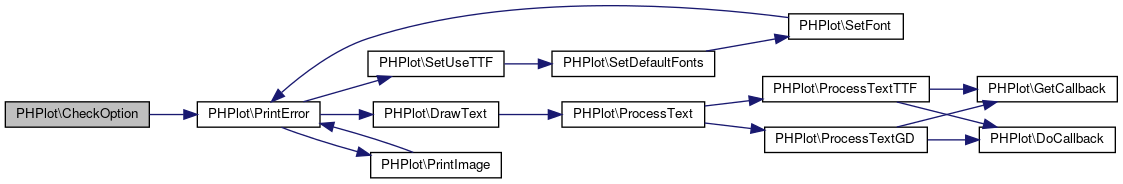 Here is the caller graph for this function:
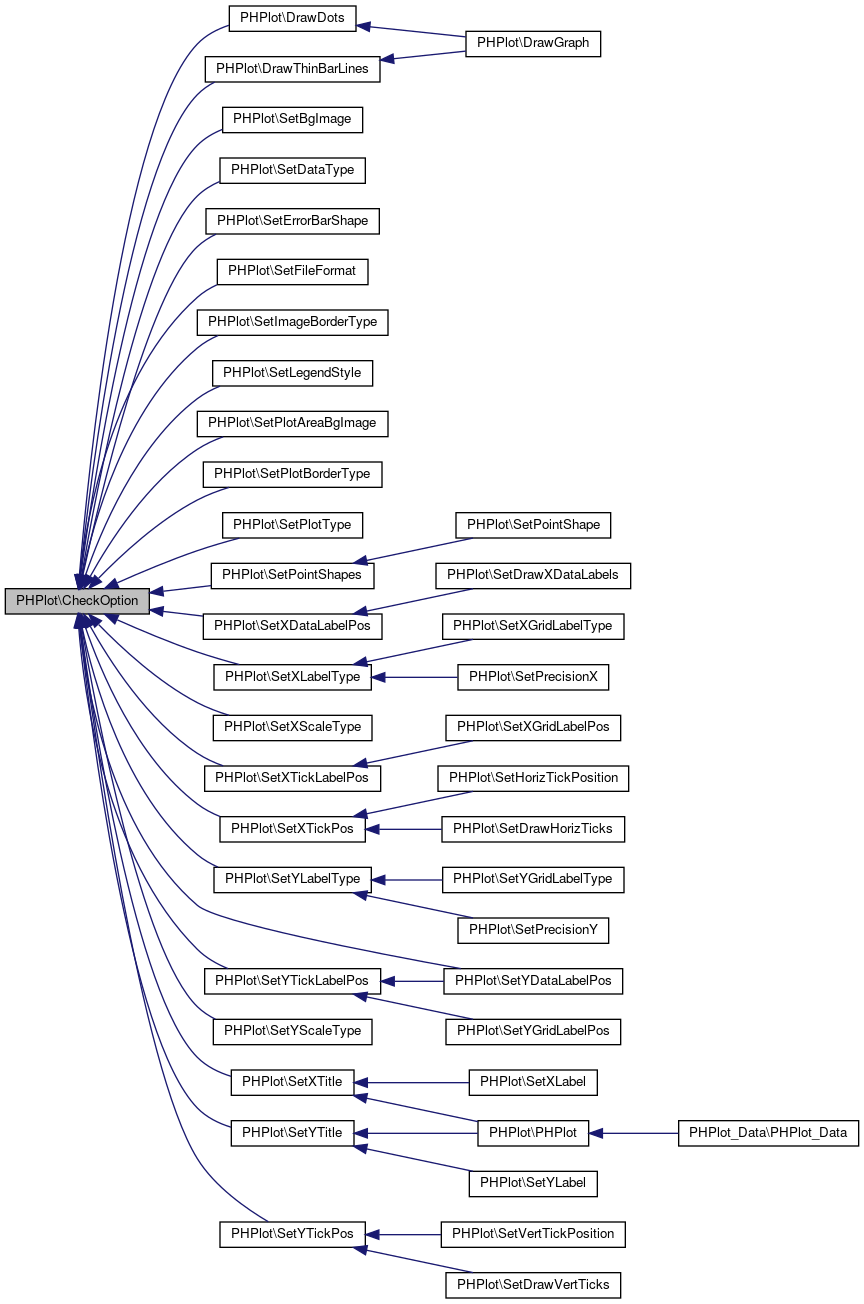
◆ DoCallback()
| PHPlot::DoCallback | ( | ) |
Definition at line 2241 of file phplot.php.
Referenced by CalcAxisPositions(), CalcMargins(), CalcMaxDataLabelSize(), CalcMaxTickLabelSize(), CalcPlotAreaPixels(), CalcPlotAreaWorld(), CalcTranslation(), DrawGraph(), FindDataLimits(), ProcessTextGD(), and ProcessTextTTF().
Here is the caller graph for this function:
◆ DrawArea()
| PHPlot::DrawArea | ( | ) |
Draw an area plot. Supported data types: 'text-data' 'data-data' NOTE: This function used to add first and last data values even on incomplete sets. That is not the behaviour now. As for missing data in between, there are two posibilities: replace the point with one on the X axis (previous way), or forget about it and use the preceding and following ones to draw the polygon. There is the possibility to use both, we just need to add the method to set it. Something like SetMissingDataBehaviour(), for example.
Definition at line 4254 of file phplot.php.
References $row, DrawXDataLabel(), xtr(), and ytr().
Referenced by DrawGraph().
Here is the call graph for this function: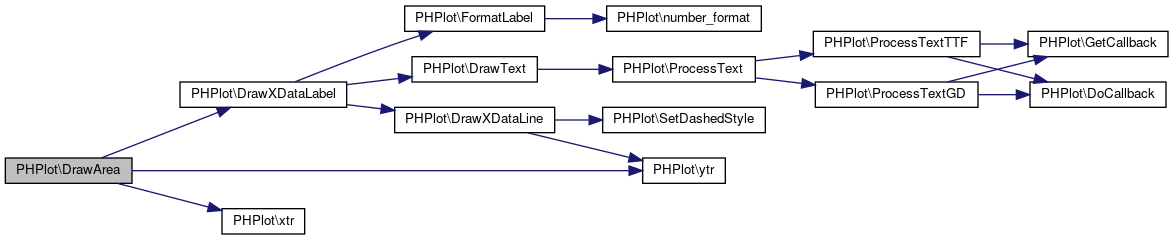 Here is the caller graph for this function:
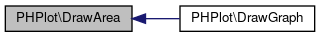
◆ DrawAxisLegend()
| PHPlot::DrawAxisLegend | ( | ) |
TODO Draws a legend over (or below) an axis of the plot.
Definition at line 3886 of file phplot.php.
◆ DrawBackground()
| PHPlot::DrawBackground | ( | ) |
Fills the background.
Definition at line 3241 of file phplot.php.
References tile_img().
Referenced by DrawGraph().
Here is the call graph for this function: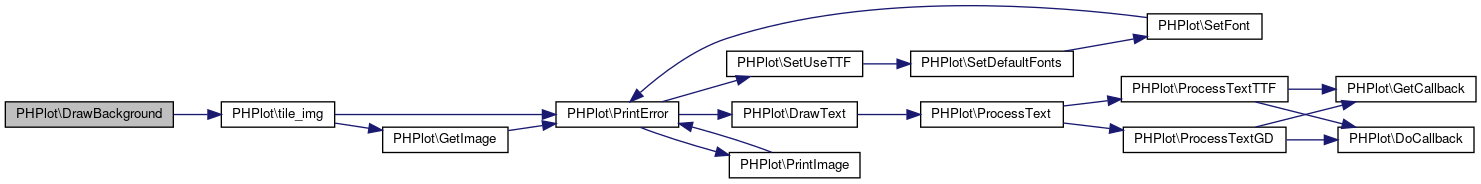 Here is the caller graph for this function:
◆ DrawBars()
| PHPlot::DrawBars | ( | ) |
Data comes in as array("title", x, y, y2, y3, ...)
Definition at line 4517 of file phplot.php.
References $row, $shading, DrawDataLabel(), DrawXDataLabel(), PrintError(), xtr(), and ytr().
Referenced by DrawGraph().
Here is the call graph for this function: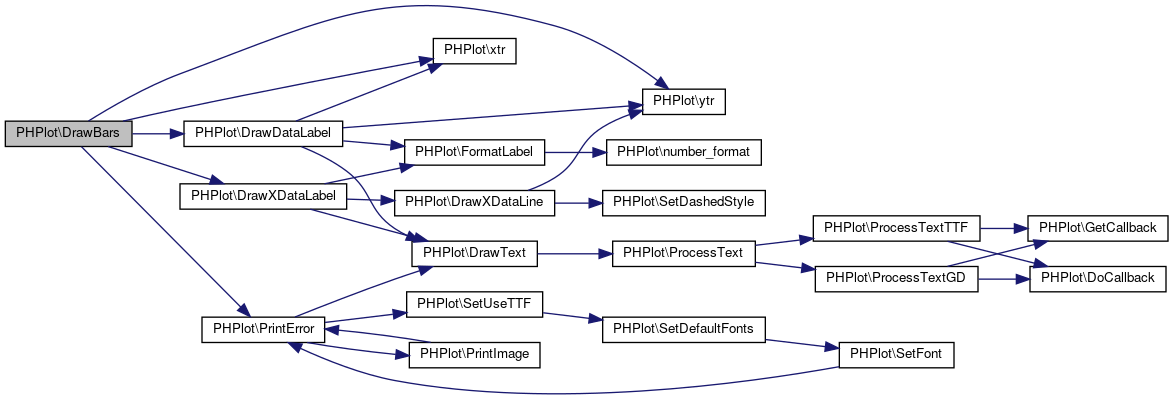 Here is the caller graph for this function:
◆ DrawDataLabel()
| PHPlot::DrawDataLabel | ( | $which_font, | |
| $which_angle, | |||
| $x_world, | |||
| $y_world, | |||
| $which_color, | |||
| $which_text, | |||
$which_halign = 'center', |
|||
$which_valign = 'bottom', |
|||
$x_adjustment = 0, |
|||
$y_adjustment = 0 |
|||
| ) |
Draws the data label associated with a point in the plot at specified x/y world position. This is currently only used for Y data labels for bar charts.
Definition at line 3678 of file phplot.php.
References $x_label_angle, DrawText(), FormatLabel(), xtr(), and ytr().
Referenced by DrawBars().
Here is the call graph for this function: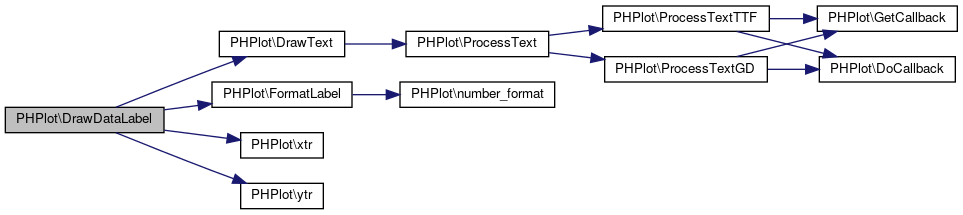 Here is the caller graph for this function:
◆ DrawDot()
| PHPlot::DrawDot | ( | $x_world, | |
| $y_world, | |||
| $record, | |||
| $color | |||
| ) |
Draws a styled dot. Uses world coordinates. Supported types: 'halfline', 'line', 'plus', 'cross', 'rect', 'circle', 'dot', 'diamond', 'triangle', 'trianglemid'
Definition at line 4181 of file phplot.php.
Referenced by DrawDots(), and DrawDotsError().
Here is the call graph for this function: Here is the caller graph for this function:
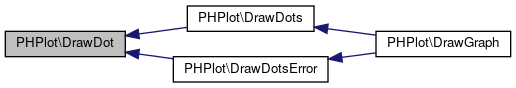
◆ DrawDots()
| PHPlot::DrawDots | ( | ) |
Definition at line 4068 of file phplot.php.
References $row, CheckOption(), DrawDot(), DrawXDataLabel(), and xtr().
Referenced by DrawGraph().
Here is the call graph for this function: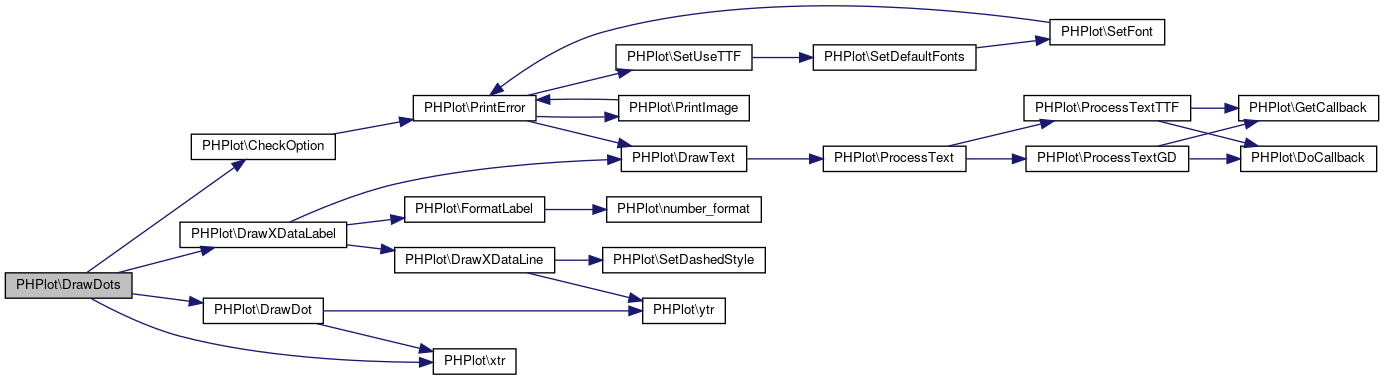 Here is the caller graph for this function:
◆ DrawDotsError()
| PHPlot::DrawDotsError | ( | ) |
Supported data formats: data-data-error, text-data-error (doesn't exist yet) ( data comes in as array("title", x, y, error+, error-, y2, error2+, error2-, ...) )
Definition at line 4023 of file phplot.php.
References $row, DrawDot(), DrawXDataLabel(), DrawYErrorBar(), PrintError(), and xtr().
Referenced by DrawGraph().
Here is the call graph for this function: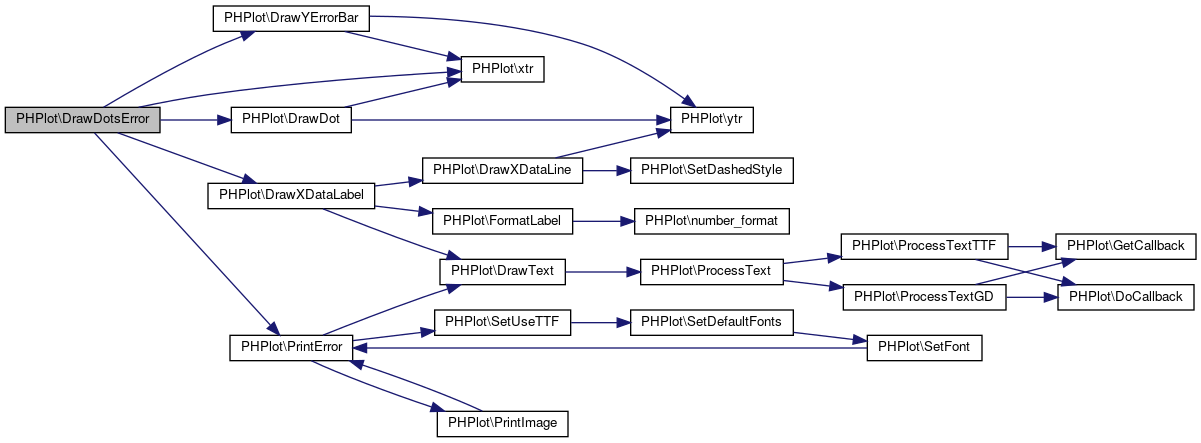 Here is the caller graph for this function:
◆ DrawError()
| PHPlot::DrawError | ( | $error_message, | |
$where_x = NULL, |
|||
$where_y = NULL |
|||
| ) |
Display an error message and exit. This is provided for backward compatibility only. Use PrintError() instead. $error_message Text of the error message $where_x, $where_y Ignored, provided for compatibility.
Definition at line 1541 of file phplot.php.
References PrintError().
Referenced by PHPlot_Data\DoDivision(), PHPlot_Data\DoExponentialMovingAverage(), PHPlot_Data\DoMovingAverage(), PHPlot_Data\DoRemoveDataSet(), and PHPlot_Data\DoScaleData().
Here is the call graph for this function: Here is the caller graph for this function:
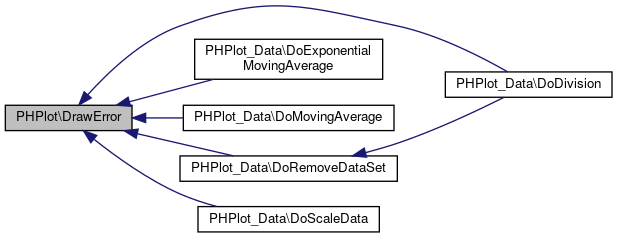
◆ DrawGraph()
| PHPlot::DrawGraph | ( | ) |
Definition at line 4653 of file phplot.php.
References CalcAxisPositions(), CalcBarWidths(), CalcMargins(), CalcPlotAreaPixels(), CalcPlotAreaWorld(), CalcTranslation(), DoCallback(), DrawArea(), DrawBackground(), DrawBars(), DrawDots(), DrawDotsError(), DrawImageBorder(), DrawLegend(), DrawLines(), DrawLinesError(), DrawPieChart(), DrawPlotAreaBackground(), DrawPlotBorder(), DrawSquared(), DrawStackedBars(), DrawThinBarLines(), DrawTitle(), DrawXAxis(), DrawXTitle(), DrawYAxis(), DrawYTitle(), FindDataLimits(), PadArrays(), PrintError(), and PrintImage().
Here is the call graph for this function:
◆ DrawImageBorder()
| PHPlot::DrawImageBorder | ( | ) |
Draws a border around the final image.
Definition at line 3329 of file phplot.php.
References PrintError().
Referenced by DrawGraph().
Here is the call graph for this function: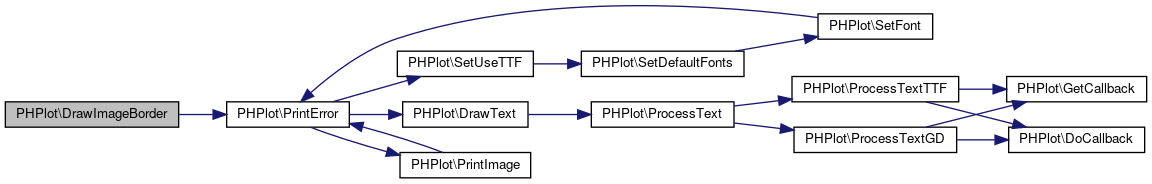 Here is the caller graph for this function:
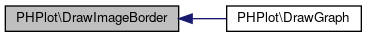
◆ DrawLegend()
| PHPlot::DrawLegend | ( | ) |
Draws the graph legend
- Note
- Base code submitted by Marlin Viss
Definition at line 3776 of file phplot.php.
References $line_spacing, $safe_margin, DrawText(), SizeText(), xtr(), and ytr().
Referenced by DrawGraph().
Here is the call graph for this function: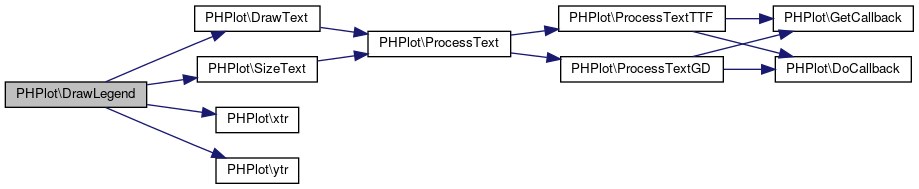 Here is the caller graph for this function:
◆ DrawLines()
| PHPlot::DrawLines | ( | ) |
Draw Lines. Supported data-types: 'data-data', 'text-data' NOTE: Please see the note regarding incomplete data sets on DrawArea()
Definition at line 4319 of file phplot.php.
References $row, DrawXDataLabel(), SetDashedStyle(), xtr(), and ytr().
Referenced by DrawGraph().
Here is the call graph for this function: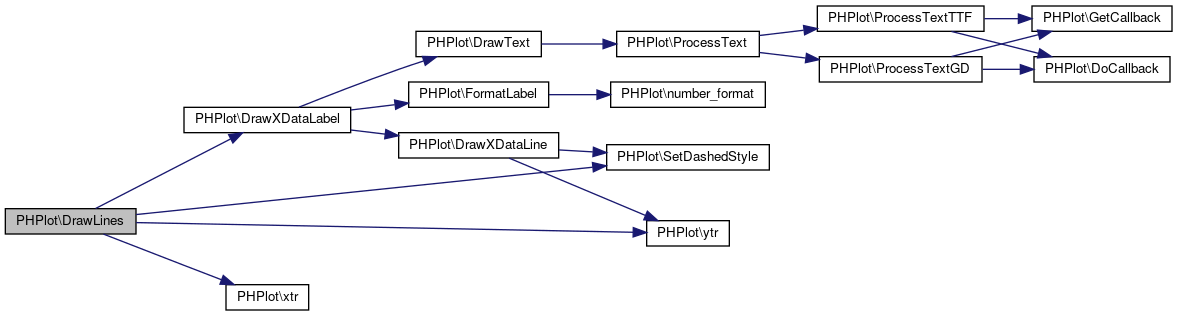 Here is the caller graph for this function:
◆ DrawLinesError()
| PHPlot::DrawLinesError | ( | ) |
Draw lines with error bars - data comes in as array("label", x, y, error+, error-, y2, error2+, error2-, ...);
Definition at line 4384 of file phplot.php.
References $row, DrawXDataLabel(), DrawYErrorBar(), PrintError(), SetDashedStyle(), xtr(), and ytr().
Referenced by DrawGraph().
Here is the call graph for this function: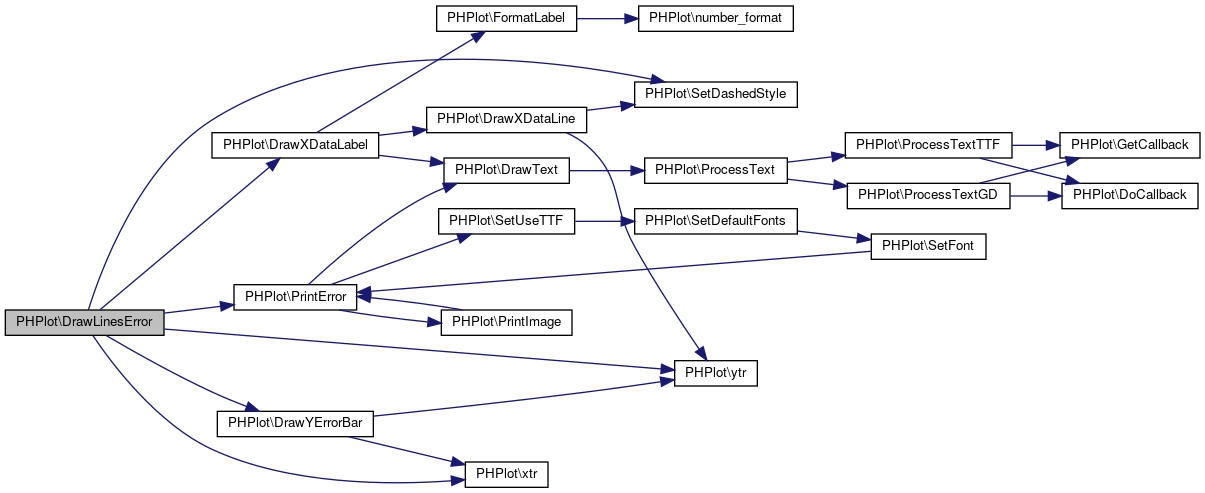 Here is the caller graph for this function:
◆ DrawPieChart()
| PHPlot::DrawPieChart | ( | ) |
Draws a pie chart. Data has to be 'text-data' type.
This can work in two ways: the classical, with a column for each sector (computes the column totals and draws the pie with that) OR Takes each row as a sector and uses it's first value. This has the added advantage of using the labels provided, which is not the case with the former method. This might prove useful for pie charts from GROUP BY sql queries
Definition at line 3909 of file phplot.php.
References $legend, $total, DrawText(), number_format(), and PrintError().
Referenced by DrawGraph().
Here is the call graph for this function: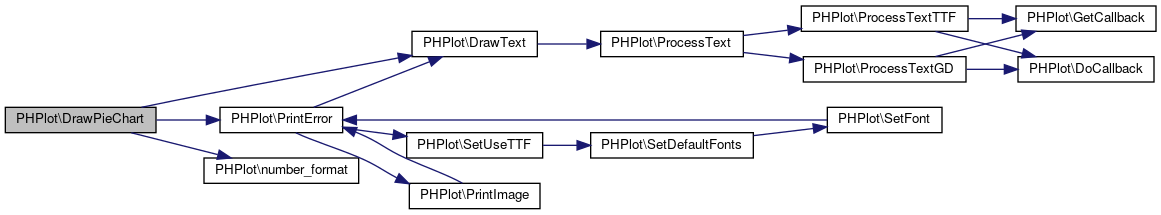 Here is the caller graph for this function:
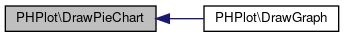
◆ DrawPlotAreaBackground()
| PHPlot::DrawPlotAreaBackground | ( | ) |
Fills the plot area background.
Definition at line 3260 of file phplot.php.
References tile_img().
Referenced by DrawGraph().
Here is the call graph for this function: Here is the caller graph for this function:
◆ DrawPlotBorder()
| PHPlot::DrawPlotBorder | ( | ) |
Definition at line 3641 of file phplot.php.
References ytr().
Referenced by DrawGraph().
Here is the call graph for this function: Here is the caller graph for this function:
◆ DrawSquared()
| PHPlot::DrawSquared | ( | ) |
This is a mere copy of DrawLines() with one more line drawn for each point
Definition at line 4451 of file phplot.php.
References $row, DrawXDataLabel(), SetDashedStyle(), xtr(), and ytr().
Referenced by DrawGraph().
Here is the call graph for this function: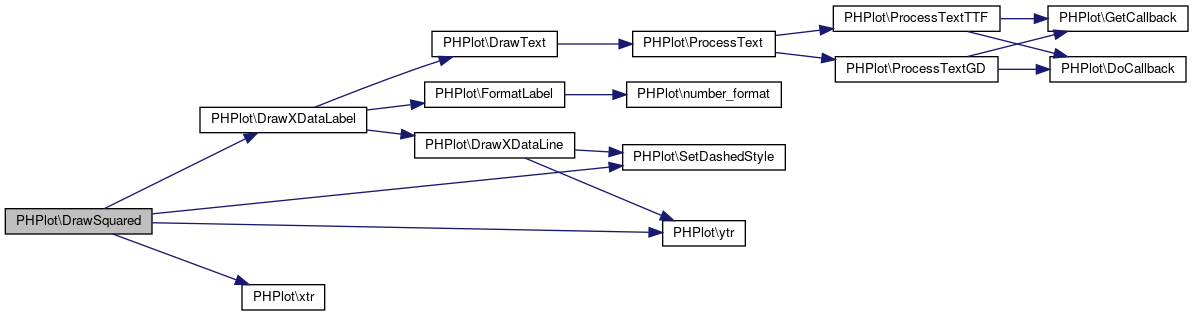 Here is the caller graph for this function:
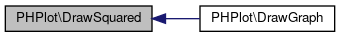
◆ DrawStackedBars()
| PHPlot::DrawStackedBars | ( | ) |
Data comes in as array("title", x, y, y2, y3, ...)
- Note
- Original stacked bars idea by Laurent Kruk < lolok at users.sourceforge.net >
Definition at line 4597 of file phplot.php.
References $row, DrawXDataLabel(), PrintError(), xtr(), and ytr().
Referenced by DrawGraph().
Here is the call graph for this function: Here is the caller graph for this function:
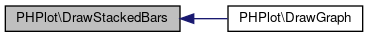
◆ DrawText()
| PHPlot::DrawText | ( | $which_font, | |
| $which_angle, | |||
| $which_xpos, | |||
| $which_ypos, | |||
| $which_color, | |||
| $which_text, | |||
$which_halign = 'left', |
|||
$which_valign = 'bottom' |
|||
| ) |
Definition at line 1314 of file phplot.php.
References ProcessText().
Referenced by DrawDataLabel(), DrawLegend(), DrawPieChart(), DrawTitle(), DrawXDataLabel(), DrawXTick(), DrawXTitle(), DrawYTick(), DrawYTitle(), and PrintError().
Here is the call graph for this function: Here is the caller graph for this function:
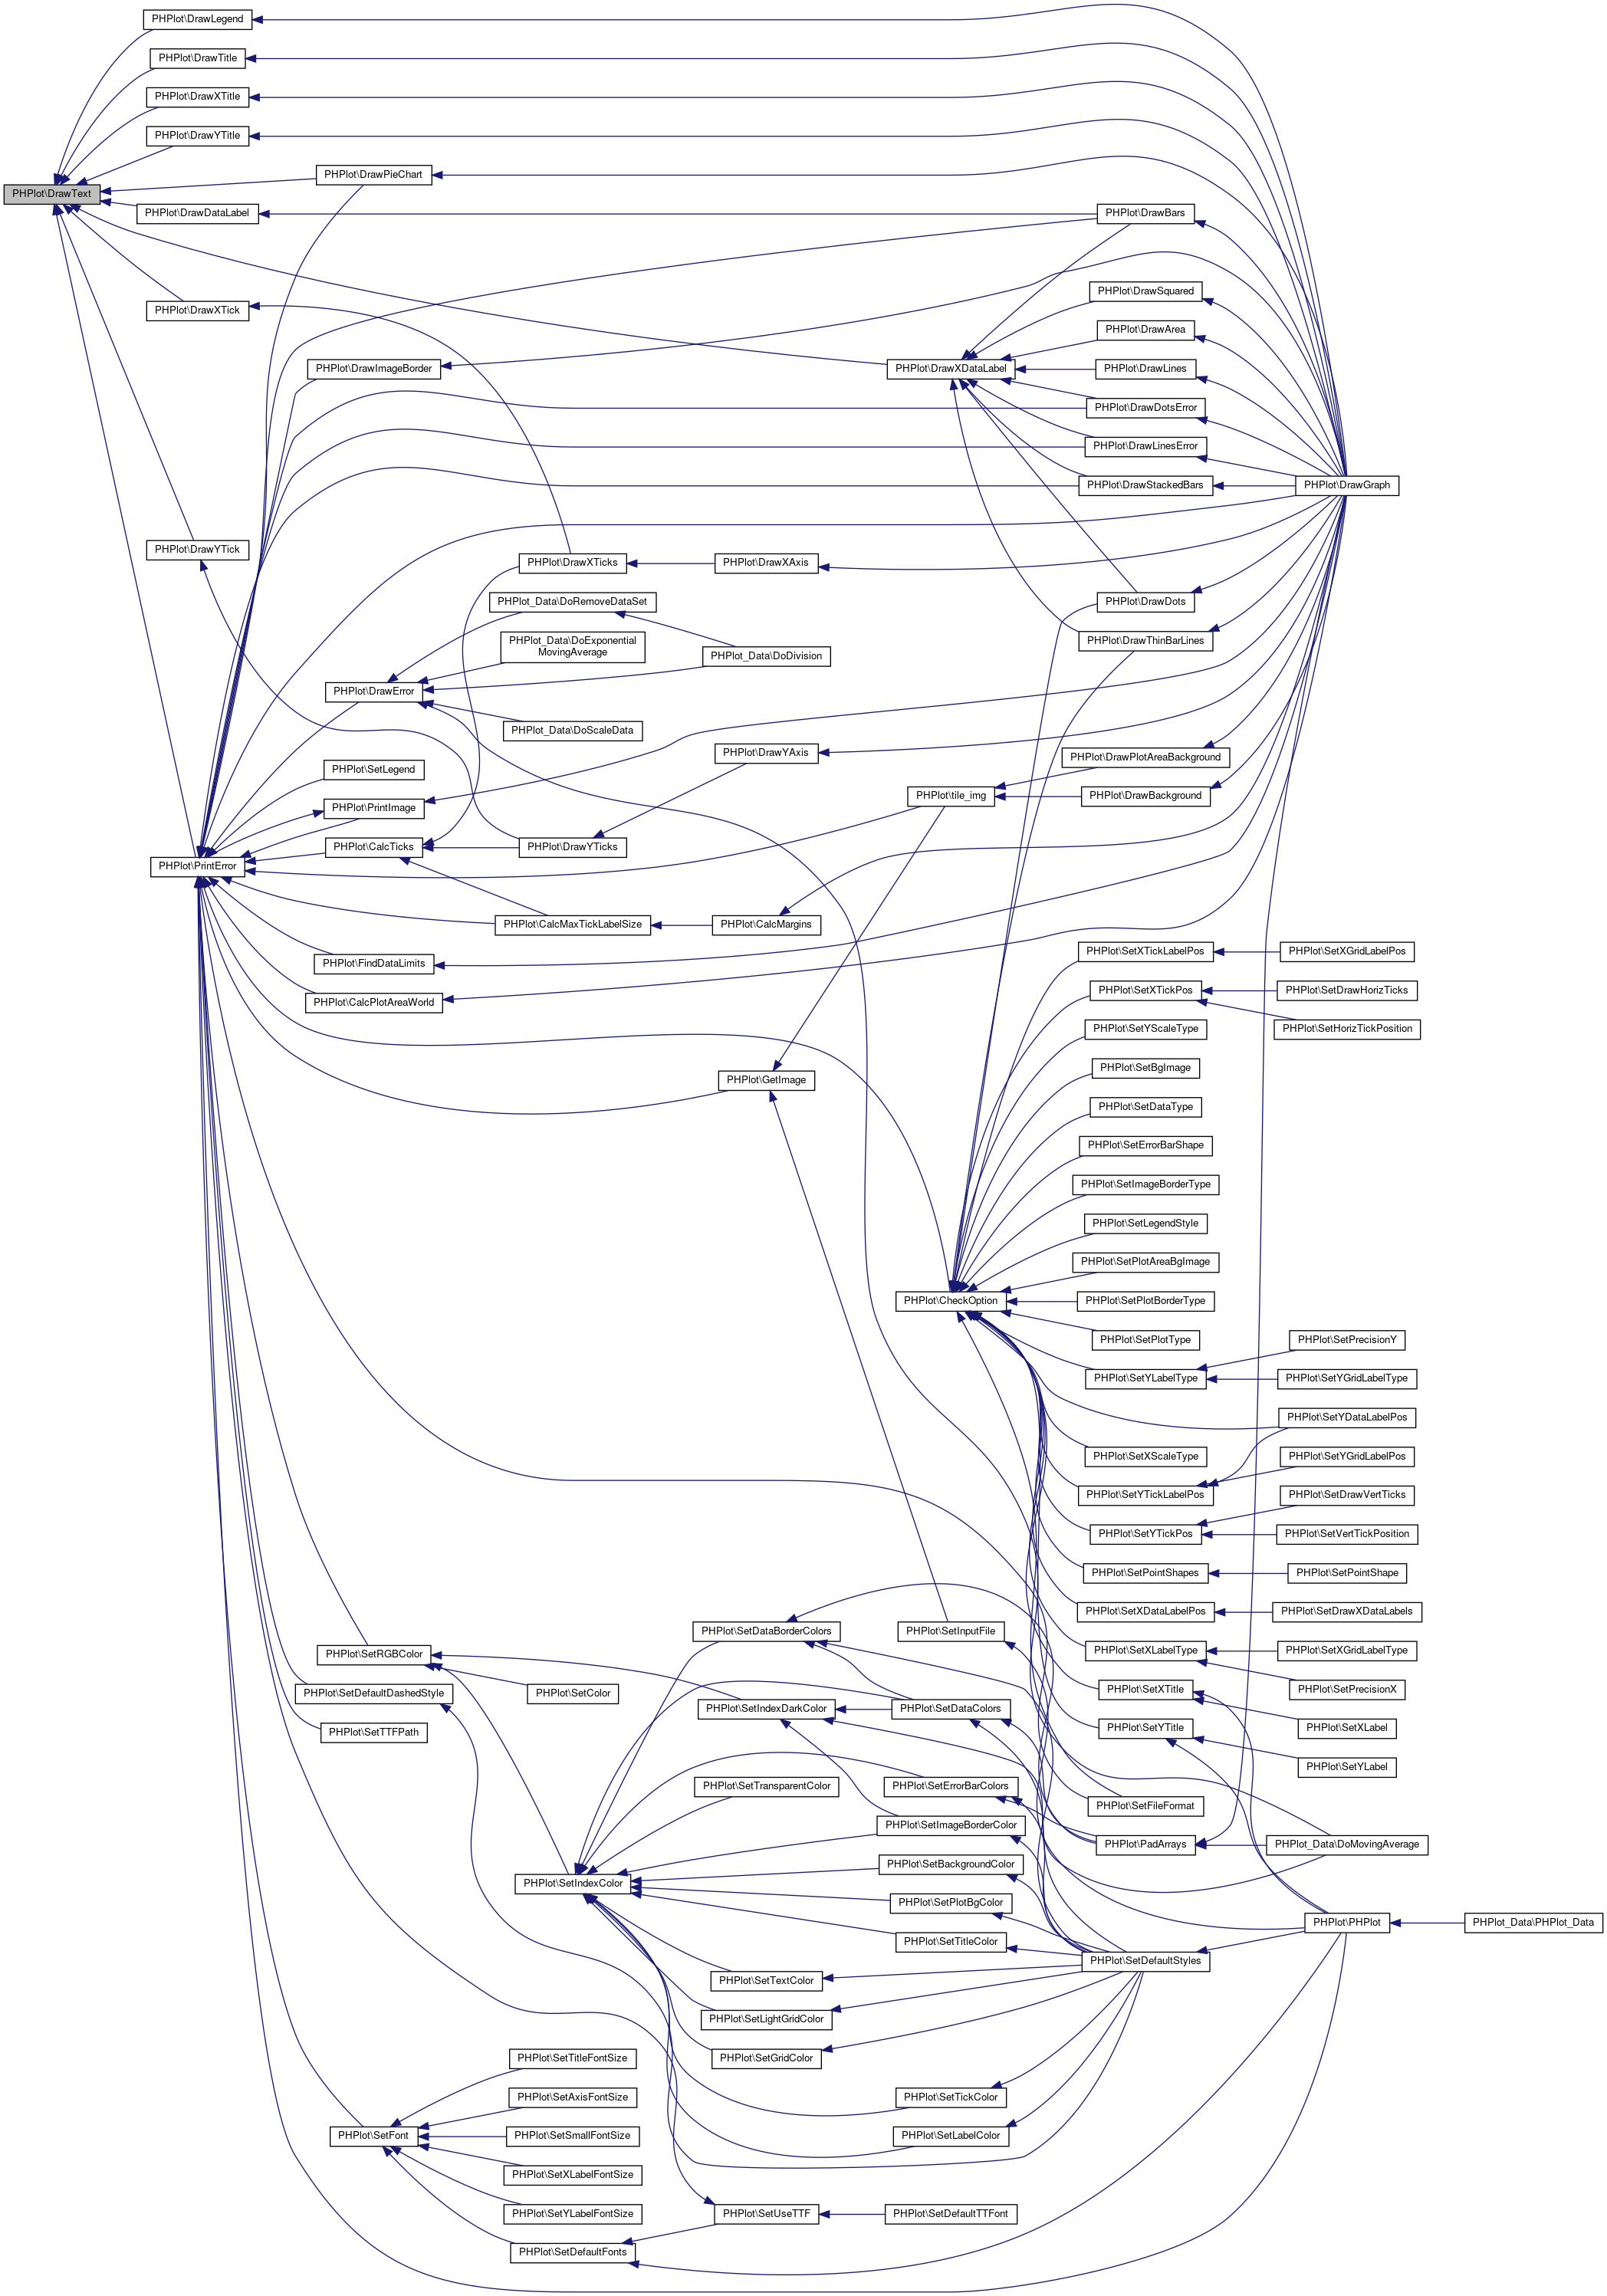
◆ DrawThinBarLines()
| PHPlot::DrawThinBarLines | ( | ) |
A clean, fast routine for when you just want charts like stock volume charts
Definition at line 4106 of file phplot.php.
References $row, CheckOption(), DrawXDataLabel(), xtr(), and ytr().
Referenced by DrawGraph().
Here is the call graph for this function: Here is the caller graph for this function:
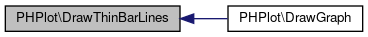
◆ DrawTitle()
| PHPlot::DrawTitle | ( | ) |
Adds the title to the graph.
Definition at line 3366 of file phplot.php.
References $safe_margin, and DrawText().
Referenced by DrawGraph().
Here is the call graph for this function: Here is the caller graph for this function:
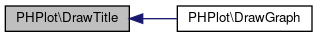
◆ DrawXAxis()
| PHPlot::DrawXAxis | ( | ) |
Definition at line 3455 of file phplot.php.
References DrawXTicks().
Referenced by DrawGraph().
Here is the call graph for this function: Here is the caller graph for this function:
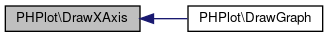
◆ DrawXDataLabel()
| PHPlot::DrawXDataLabel | ( | $xlab, | |
| $xpos, | |||
$row = FALSE |
|||
| ) |
Draws the data label associated with a point in the plot. This is different from x_labels drawn by DrawXTicks() and care should be taken not to draw both, as they'd probably overlap. Calling of this function in DrawLines(), etc is decided after x_data_label_pos value. Leave the last parameter out, to avoid the drawing of vertical lines, no matter what the setting is (for plots that need it, like DrawSquared())
Definition at line 3709 of file phplot.php.
References $row, DrawText(), DrawXDataLine(), and FormatLabel().
Referenced by DrawArea(), DrawBars(), DrawDots(), DrawDotsError(), DrawLines(), DrawLinesError(), DrawSquared(), DrawStackedBars(), and DrawThinBarLines().
Here is the call graph for this function: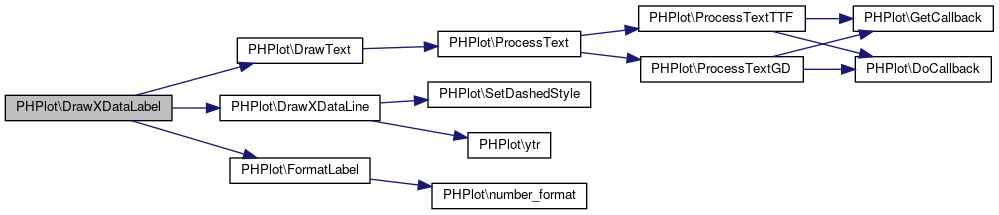 Here is the caller graph for this function:
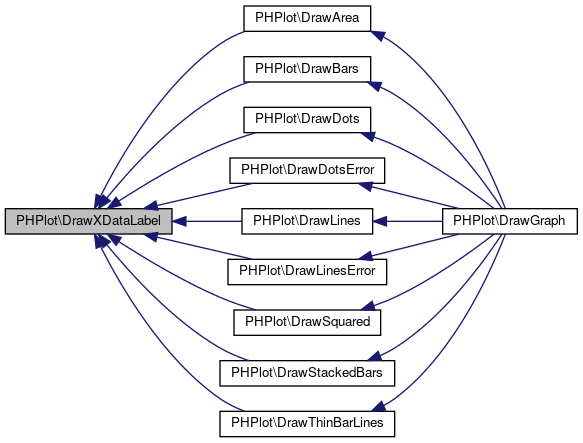
◆ DrawXDataLine()
| PHPlot::DrawXDataLine | ( | $xpos, | |
| $row | |||
| ) |
Draws Vertical lines from data points up and down. Which lines are drawn depends on the value of x_data_label_pos, and whether this is at all done or not, on draw_x_data_label_lines
- Parameters
-
xpos int position in pixels of the line. row int index of the data row being drawn.
Definition at line 3743 of file phplot.php.
References $row, SetDashedStyle(), and ytr().
Referenced by DrawXDataLabel().
Here is the call graph for this function: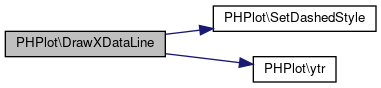 Here is the caller graph for this function:
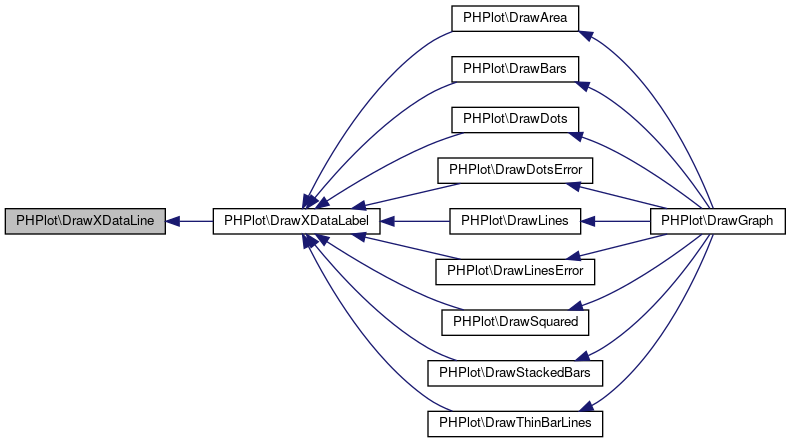
◆ DrawXTick()
| PHPlot::DrawXTick | ( | $which_xlab, | |
| $which_xpix | |||
| ) |
Draw one X tick mark and its tick label.
Definition at line 3559 of file phplot.php.
References DrawText().
Referenced by DrawXTicks().
Here is the call graph for this function: Here is the caller graph for this function:
◆ DrawXTicks()
| PHPlot::DrawXTicks | ( | ) |
Draws Grid, Ticks and Tick Labels along X-Axis Ticks and tick labels can be down of plot only, up of plot only, both on up and down of plot, or crossing a user defined X-axis
- Note
- Original vertical code submitted by Marlin Viss
Definition at line 3609 of file phplot.php.
References CalcTicks(), DrawXTick(), FormatLabel(), SetDashedStyle(), and xtr().
Referenced by DrawXAxis().
Here is the call graph for this function: Here is the caller graph for this function:
◆ DrawXTitle()
| PHPlot::DrawXTitle | ( | ) |
Draws the X-Axis Title
Definition at line 3388 of file phplot.php.
References DrawText().
Referenced by DrawGraph().
Here is the call graph for this function: Here is the caller graph for this function:
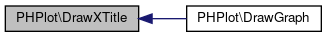
◆ DrawYAxis()
| PHPlot::DrawYAxis | ( | ) |
Definition at line 3440 of file phplot.php.
References DrawYTicks().
Referenced by DrawGraph().
Here is the call graph for this function: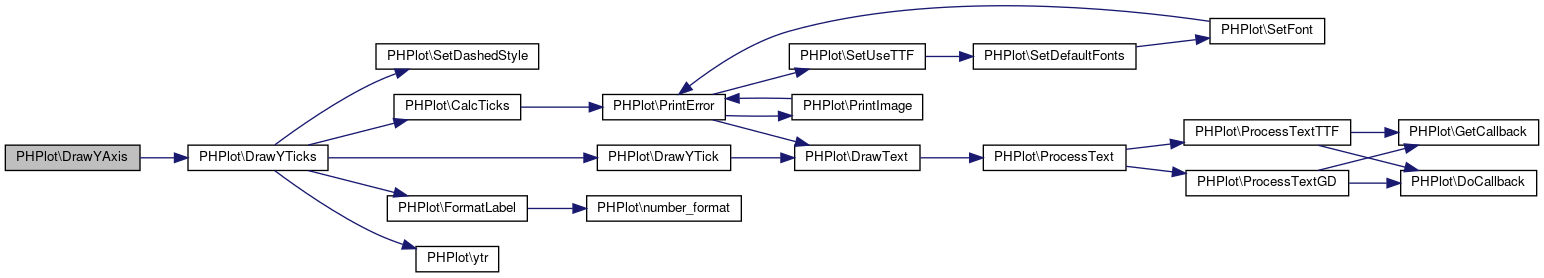 Here is the caller graph for this function:
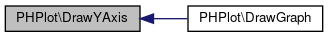
◆ DrawYErrorBar()
| PHPlot::DrawYErrorBar | ( | $x_world, | |
| $y_world, | |||
| $error_height, | |||
| $error_bar_type, | |||
| $color | |||
| ) |
Definition at line 4144 of file phplot.php.
Referenced by DrawDotsError(), and DrawLinesError().
Here is the call graph for this function: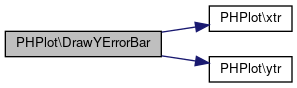 Here is the caller graph for this function:
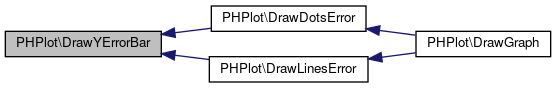
◆ DrawYTick()
| PHPlot::DrawYTick | ( | $which_ylab, | |
| $which_ypix | |||
| ) |
Draw one Y tick mark and its tick label. Called from DrawYTicks() and DrawXAxis()
Definition at line 3479 of file phplot.php.
References DrawText().
Referenced by DrawYTicks().
Here is the call graph for this function: Here is the caller graph for this function:
◆ DrawYTicks()
| PHPlot::DrawYTicks | ( | ) |
Draws Grid, Ticks and Tick Labels along Y-Axis Ticks and ticklabels can be left of plot only, right of plot only, both on the left and right of plot, or crossing a user defined Y-axis TODO: marks at whole numbers (-10, 10, 20, 30 ...) no matter where the plot begins (-3, 4.7, etc.)
Definition at line 3528 of file phplot.php.
References CalcTicks(), DrawYTick(), FormatLabel(), SetDashedStyle(), and ytr().
Referenced by DrawYAxis().
Here is the call graph for this function: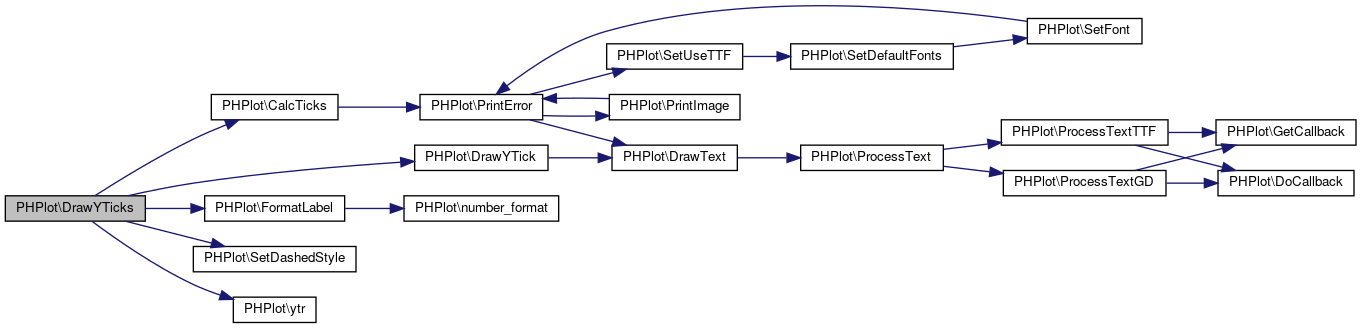 Here is the caller graph for this function:
◆ DrawYTitle()
| PHPlot::DrawYTitle | ( | ) |
Draws the Y-Axis Title
Definition at line 3414 of file phplot.php.
References DrawText().
Referenced by DrawGraph().
Here is the call graph for this function: Here is the caller graph for this function:
◆ FindDataLimits()
| PHPlot::FindDataLimits | ( | ) |
Analizes data and sets up internal maxima and minima Needed by: CalcMargins(), ... Text-Data is different than data-data graphs. For them what we have, instead of X values, is # of records equally spaced on data. text-data is passed in as $data[] = (title, y1, y2, y3, y4, ...) data-data is passed in as $data[] = (title, x, y1, y2, y3, y4, ...)
Definition at line 2266 of file phplot.php.
References DoCallback(), GetCallback(), and PrintError().
Referenced by DrawGraph().
Here is the call graph for this function: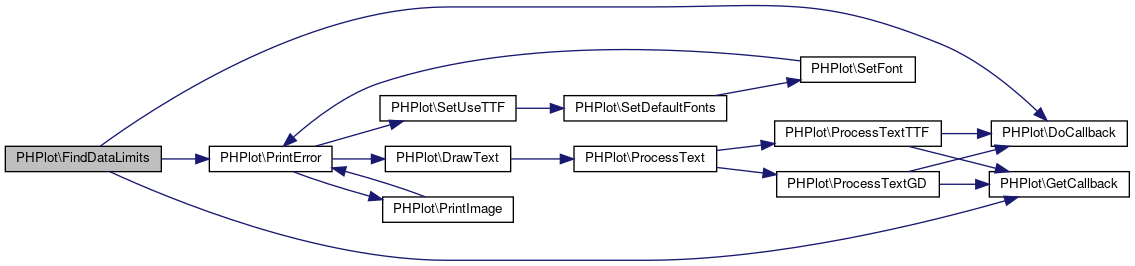 Here is the caller graph for this function:
◆ FormatLabel()
| PHPlot::FormatLabel | ( | $which_pos, | |
| $which_lab | |||
| ) |
Formats a tick or data label. which_pos - 'x' or 'y', selects formatting controls. which_lab - String to format as a label.
- Note
- Time formatting suggested by Marlin Viss
Definition at line 3077 of file phplot.php.
References number_format().
Referenced by CalcMaxDataLabelSize(), CalcMaxTickLabelSize(), DrawDataLabel(), DrawXDataLabel(), DrawXTicks(), and DrawYTicks().
Here is the call graph for this function: Here is the caller graph for this function:
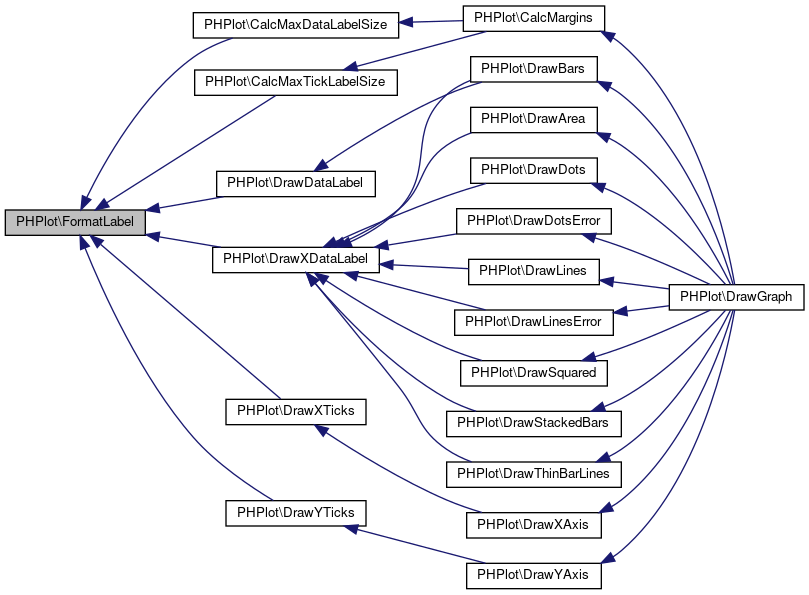
◆ GetCallback()
| PHPlot::GetCallback | ( | $reason | ) |
Definition at line 2211 of file phplot.php.
Referenced by CalcAxisPositions(), CalcMargins(), CalcMaxDataLabelSize(), CalcMaxTickLabelSize(), CalcPlotAreaWorld(), CalcTranslation(), FindDataLimits(), ProcessTextGD(), and ProcessTextTTF().
Here is the caller graph for this function: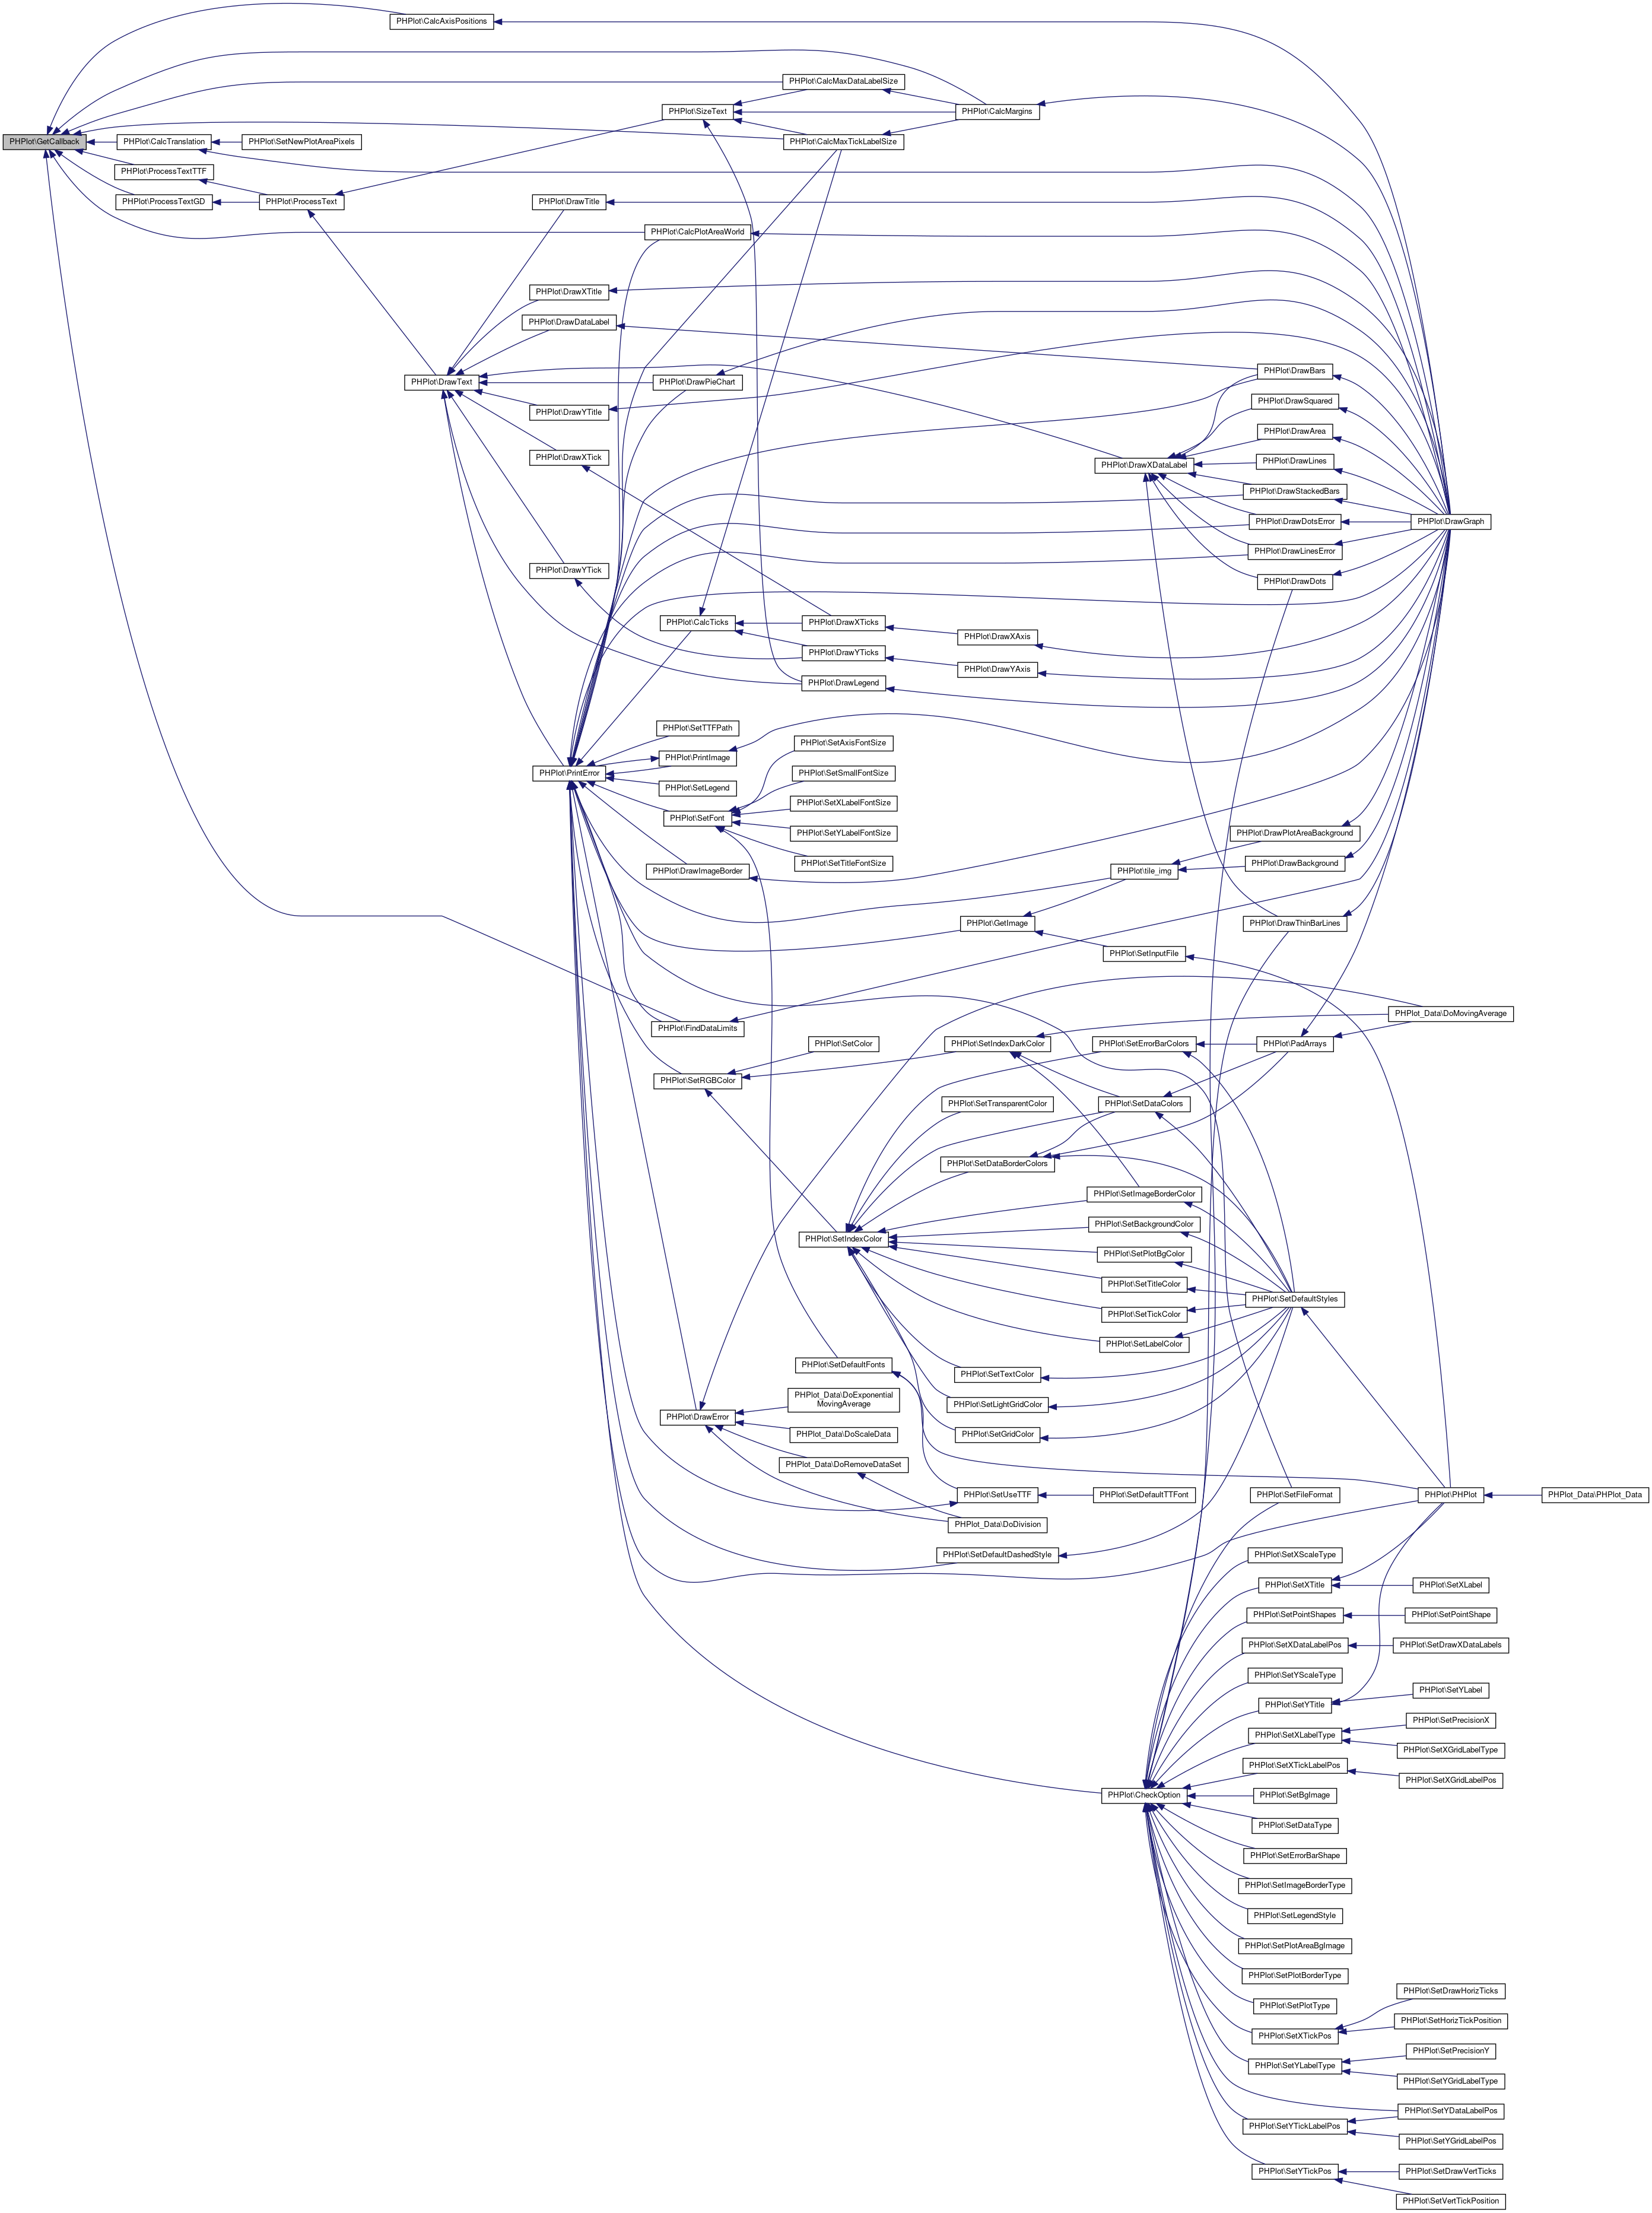
◆ GetImage()
| PHPlot::GetImage | ( | $image_filename, | |
| & | $width, | ||
| & | $height | ||
| ) |
Reads an image file. Stores width and height, and returns the image resource. On error, calls PrintError and returns False. This is used by the constructor via SetInputFile, and by tile_img().
Definition at line 249 of file phplot.php.
References $img, $size, and PrintError().
Referenced by SetInputFile(), and tile_img().
Here is the call graph for this function: Here is the caller graph for this function:
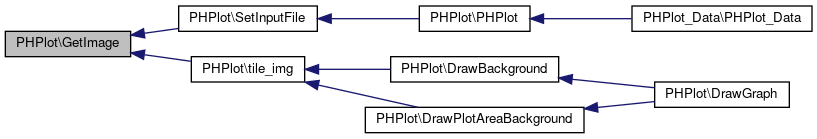
◆ number_format()
| PHPlot::number_format | ( | $number, | |
$decimals = 0 |
|||
| ) |
Definition at line 2165 of file phplot.php.
References number_format().
Referenced by DrawPieChart(), FormatLabel(), and number_format().
Here is the call graph for this function: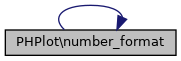 Here is the caller graph for this function:
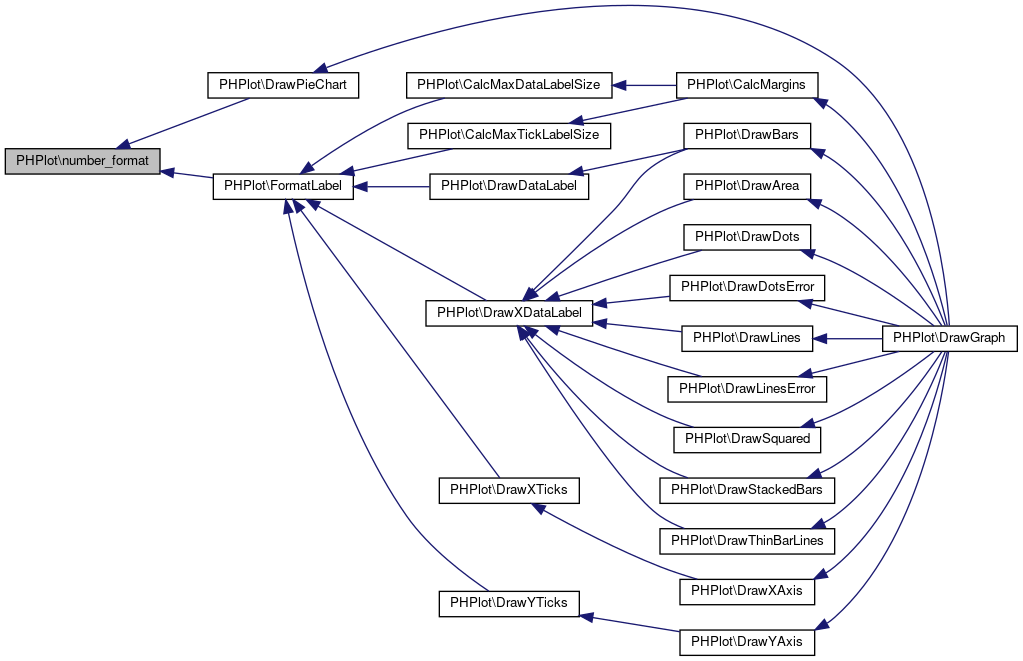
◆ pad_array()
| PHPlot::pad_array | ( | & | $arr, |
| $size | |||
| ) |
Pads an array with itself. This only works on 0-based sequential integer indexed arrays.
- Parameters
-
arr array Original array (reference), or scalar. size int Minimum size of the resulting array. If $arr is a scalar, it will be converted first to a single element array. If $arr has at least $size elements, it is unchanged. Otherwise, append elements of $arr to itself until it reaches $size elements.
Definition at line 2150 of file phplot.php.
Referenced by PadArrays(), SetPointShapes(), and SetPointSizes().
Here is the caller graph for this function: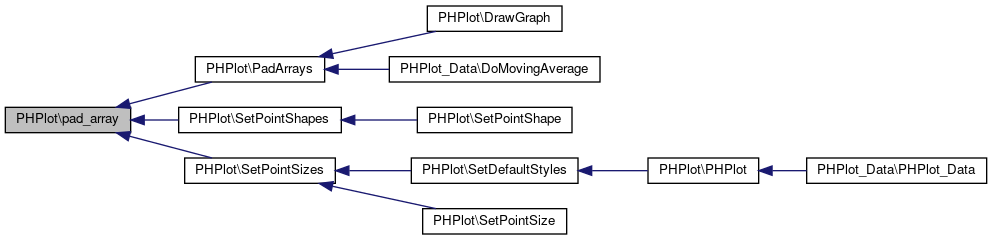
◆ PadArrays()
| PHPlot::PadArrays | ( | ) |
Pad styles arrays for later use by plot drawing functions: This removes the need for $max_data_colors, etc. and $color_index = $color_index % $max_data_colors in DrawBars(), DrawLines(), etc.
Definition at line 2126 of file phplot.php.
References pad_array(), SetDataBorderColors(), SetDataColors(), and SetErrorBarColors().
Referenced by PHPlot_Data\DoMovingAverage(), and DrawGraph().
Here is the call graph for this function: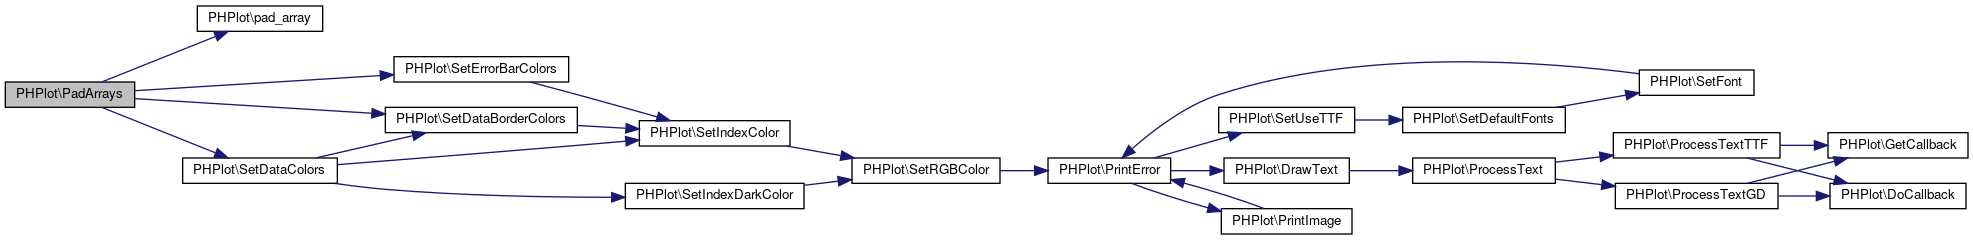 Here is the caller graph for this function:
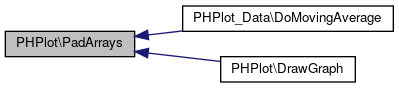
◆ PHPlot()
| PHPlot::PHPlot | ( | $which_width = 600, |
|
$which_height = 400, |
|||
$which_output_file = NULL, |
|||
$which_input_file = NULL |
|||
| ) |
Constructor: Setup img resource, colors and size of the image, and font sizes.
- Parameters
-
which_width int Image width in pixels. which_height int Image height in pixels. which_output_file string Filename for output. which_input_fule string Path to a file to be used as background.
Definition at line 212 of file phplot.php.
References PrintError(), SetDefaultFonts(), SetDefaultStyles(), SetInputFile(), SetOutputFile(), SetRGBArray(), SetTitle(), SetXTitle(), and SetYTitle().
Referenced by PHPlot_Data\PHPlot_Data().
Here is the call graph for this function: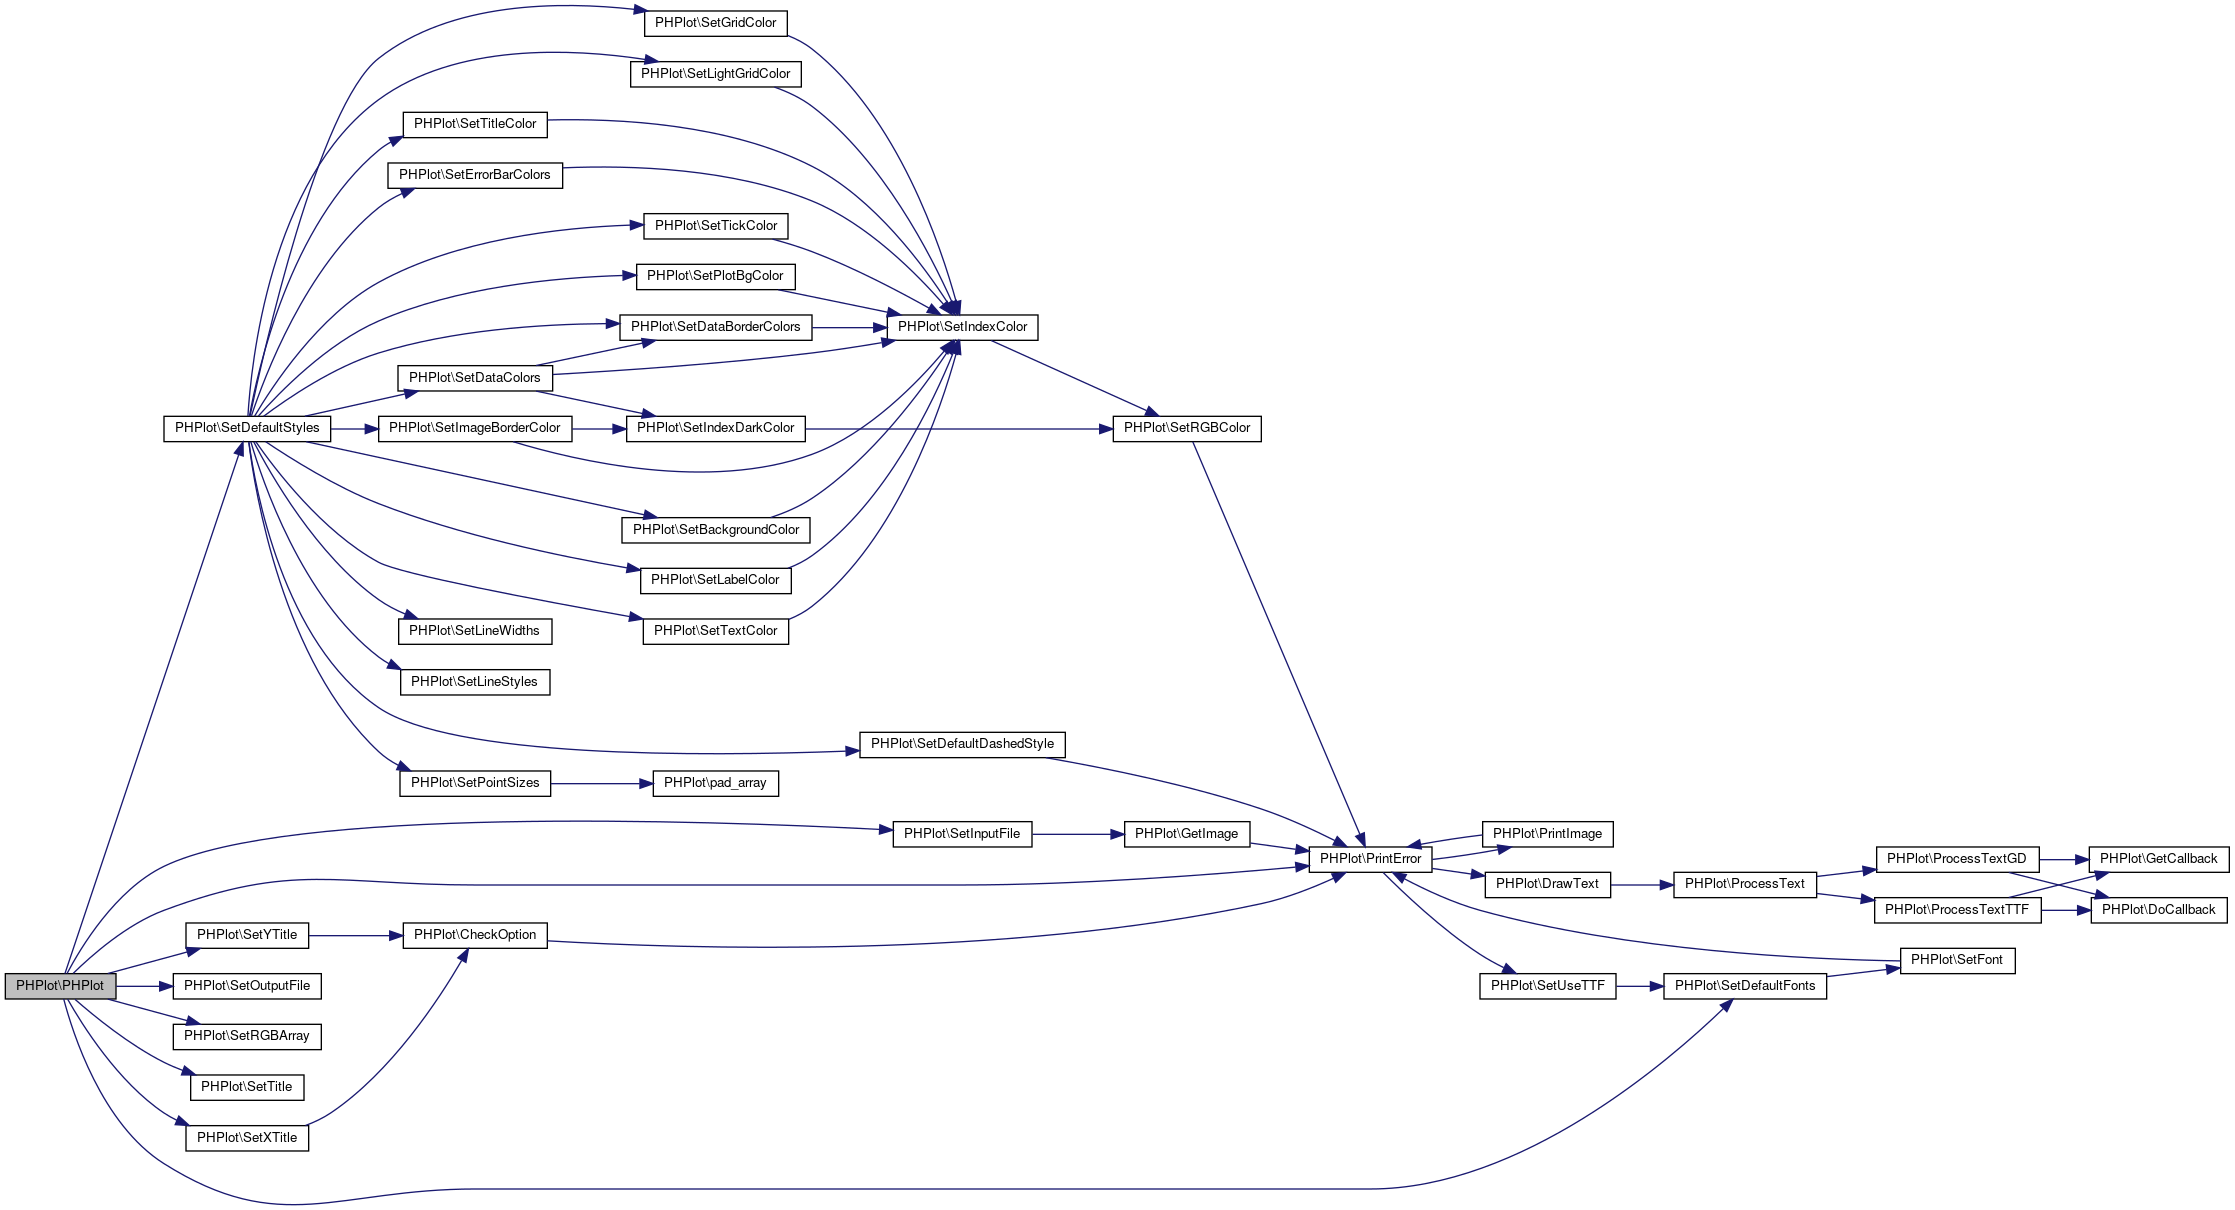 Here is the caller graph for this function:
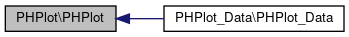
◆ PrintError()
| PHPlot::PrintError | ( | $error_message | ) |
Error handling for 'fatal' errors: $error_message Text of the error message Standard output from PHPlot is expected to be an image file, such as when handling an tag browser request. So it is not permitted to output text to standard output. (You should have display_errors=off) Here is how PHPlot handles fatal errors:
- Write the error message into an image, and output the image.
- If no image can be output, write nothing and produce an HTTP error header.
- Trigger a user-level error containing the error message. If no error handler was set up, the script will log the error and exit with non-zero status.
PrintError() and DrawError() are now equivalent. Both are provided for compatibility. (In earlier releases, PrintError sent the message to stdout only, and DrawError sent it in an image only.)
This function does not return, unless the calling script has set up an error handler which does not exit. In that case, PrintError will return False. But not all of PHPlot will handle this correctly, so it is probably a bad idea for an error handler to return.
Definition at line 1506 of file phplot.php.
References DrawText(), error(), exit, PrintImage(), and SetUseTTF().
Referenced by CalcMaxTickLabelSize(), CalcPlotAreaWorld(), CalcTicks(), CheckOption(), DrawBars(), DrawDotsError(), DrawError(), DrawGraph(), DrawImageBorder(), DrawLinesError(), DrawPieChart(), DrawStackedBars(), FindDataLimits(), GetImage(), PHPlot(), PrintImage(), SetDefaultDashedStyle(), SetFileFormat(), SetFont(), SetLegend(), SetRGBColor(), SetTTFPath(), and tile_img().
Here is the call graph for this function: Here is the caller graph for this function:
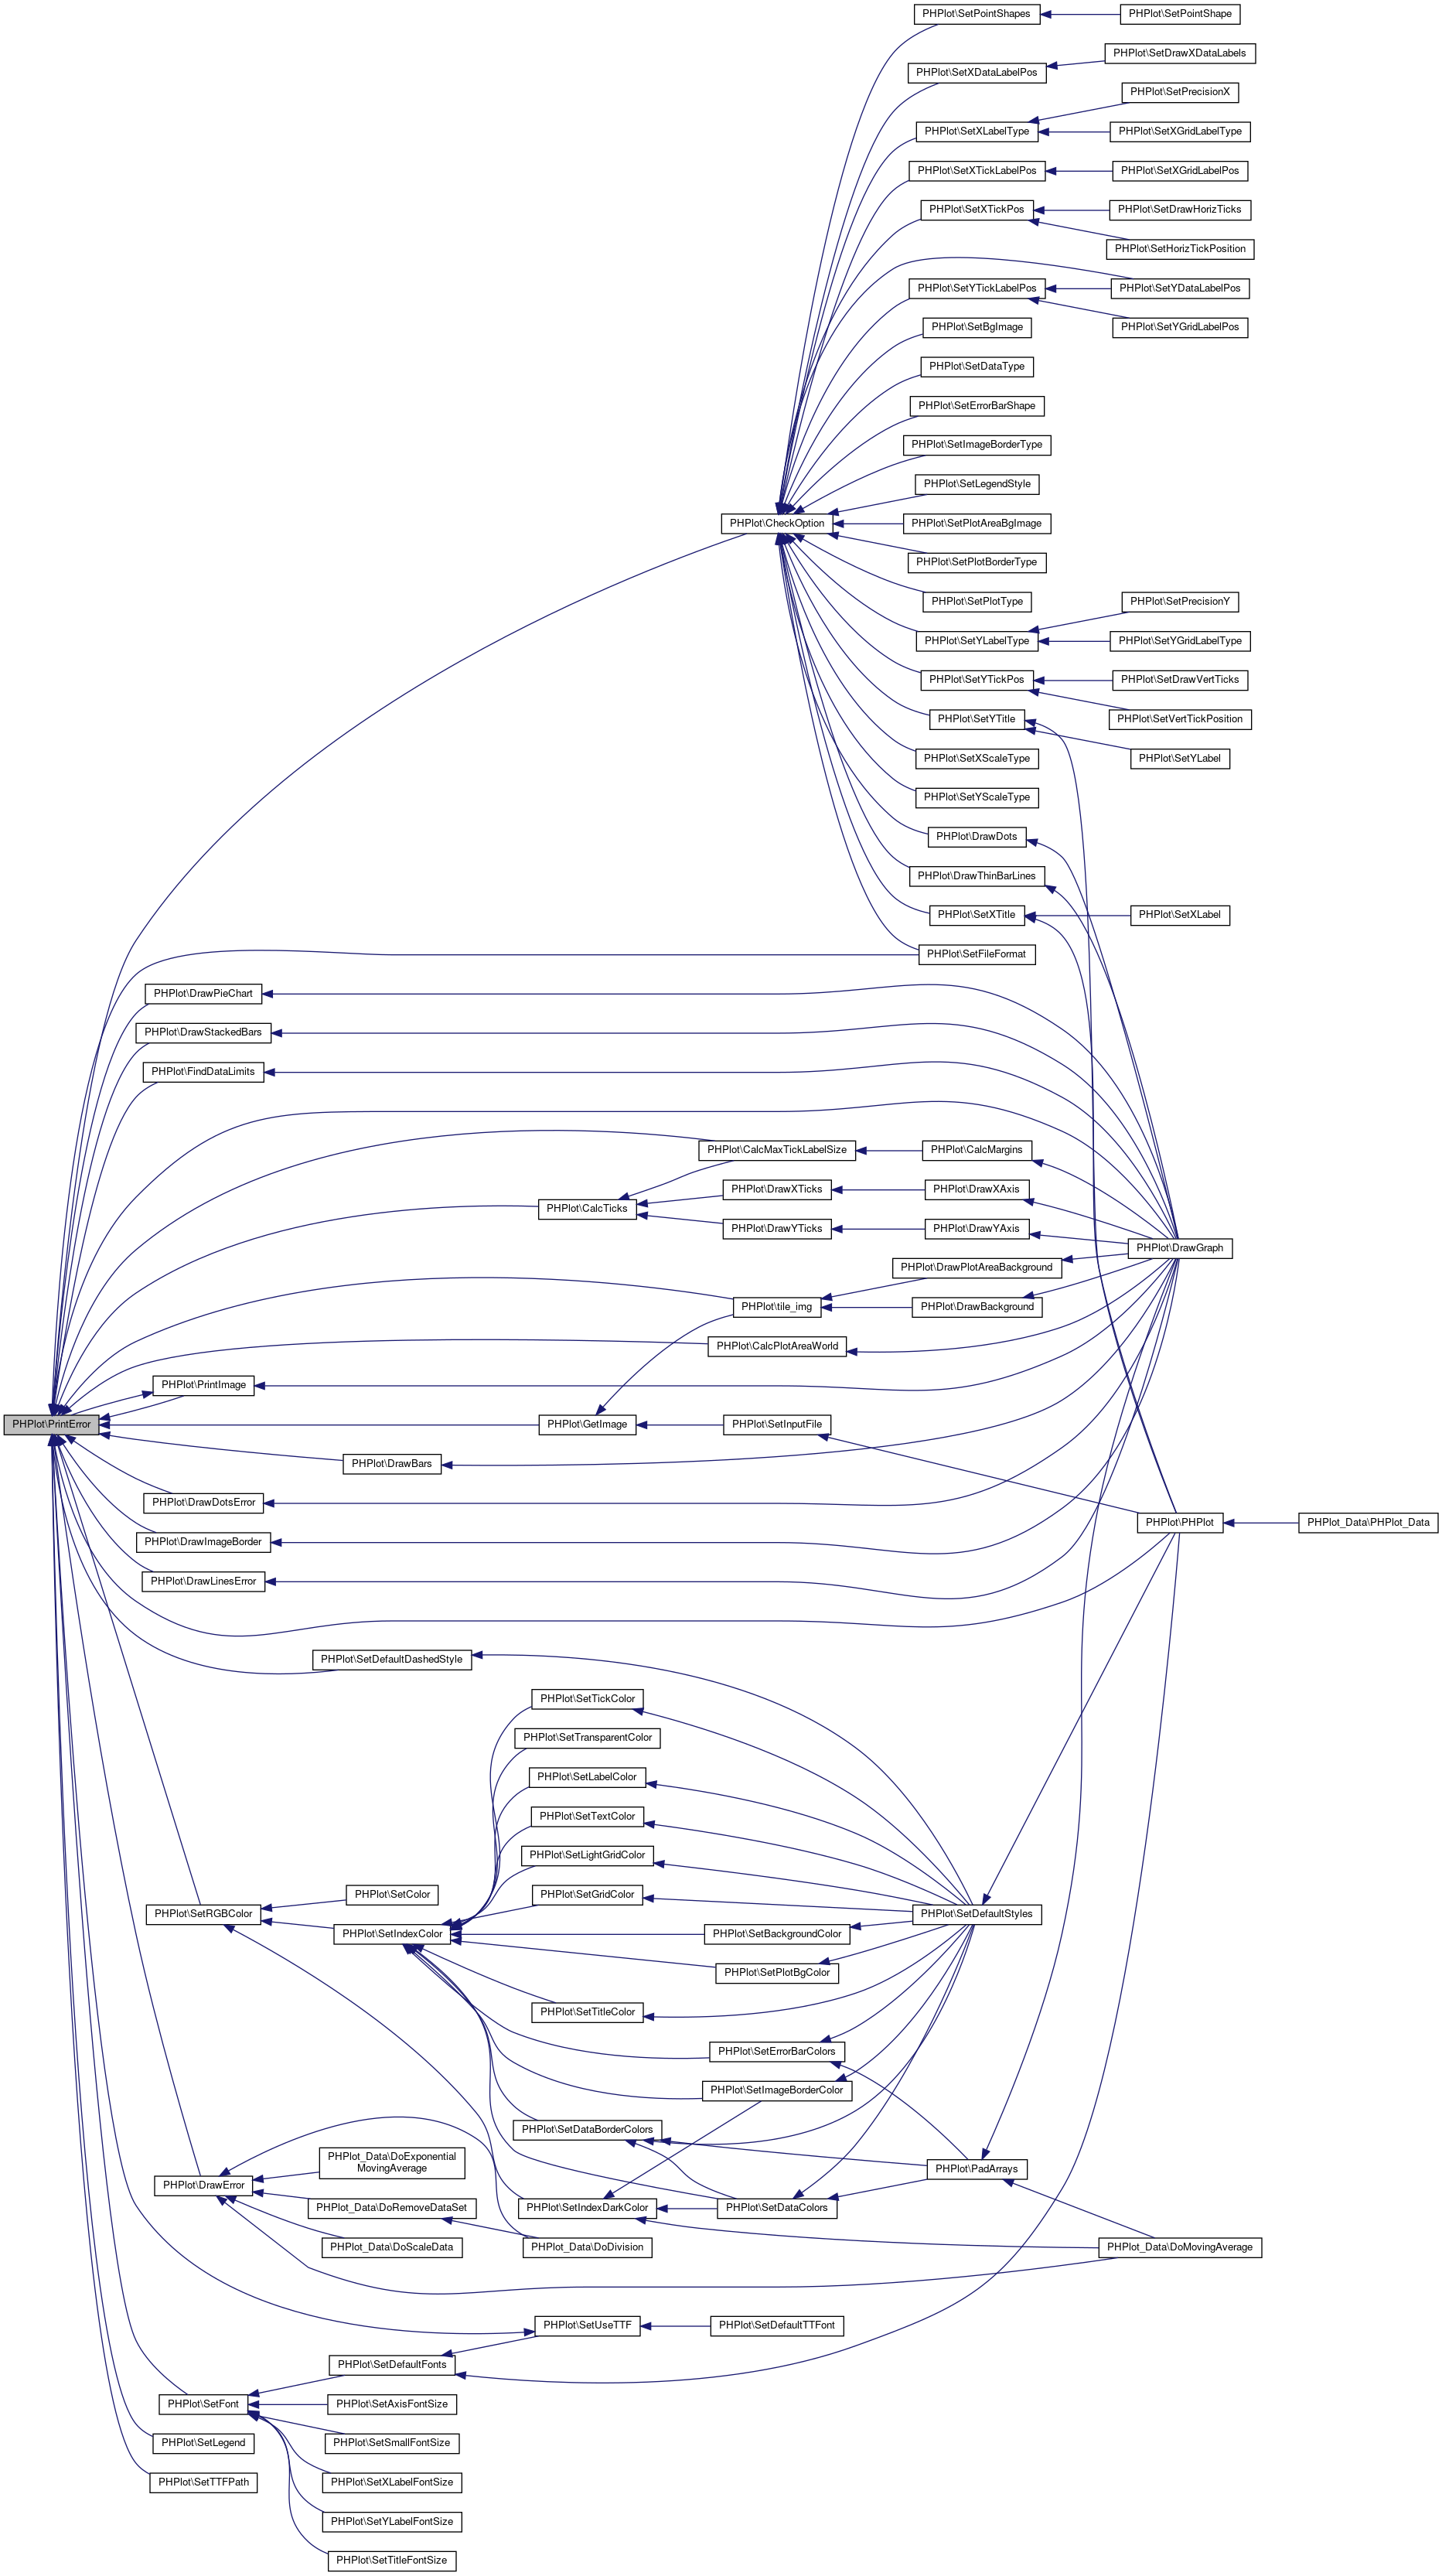
◆ PrintImage()
| PHPlot::PrintImage | ( | ) |
Performs the actual outputting of the generated graph.
Definition at line 1424 of file phplot.php.
References PrintError().
Referenced by DrawGraph(), and PrintError().
Here is the call graph for this function: Here is the caller graph for this function:
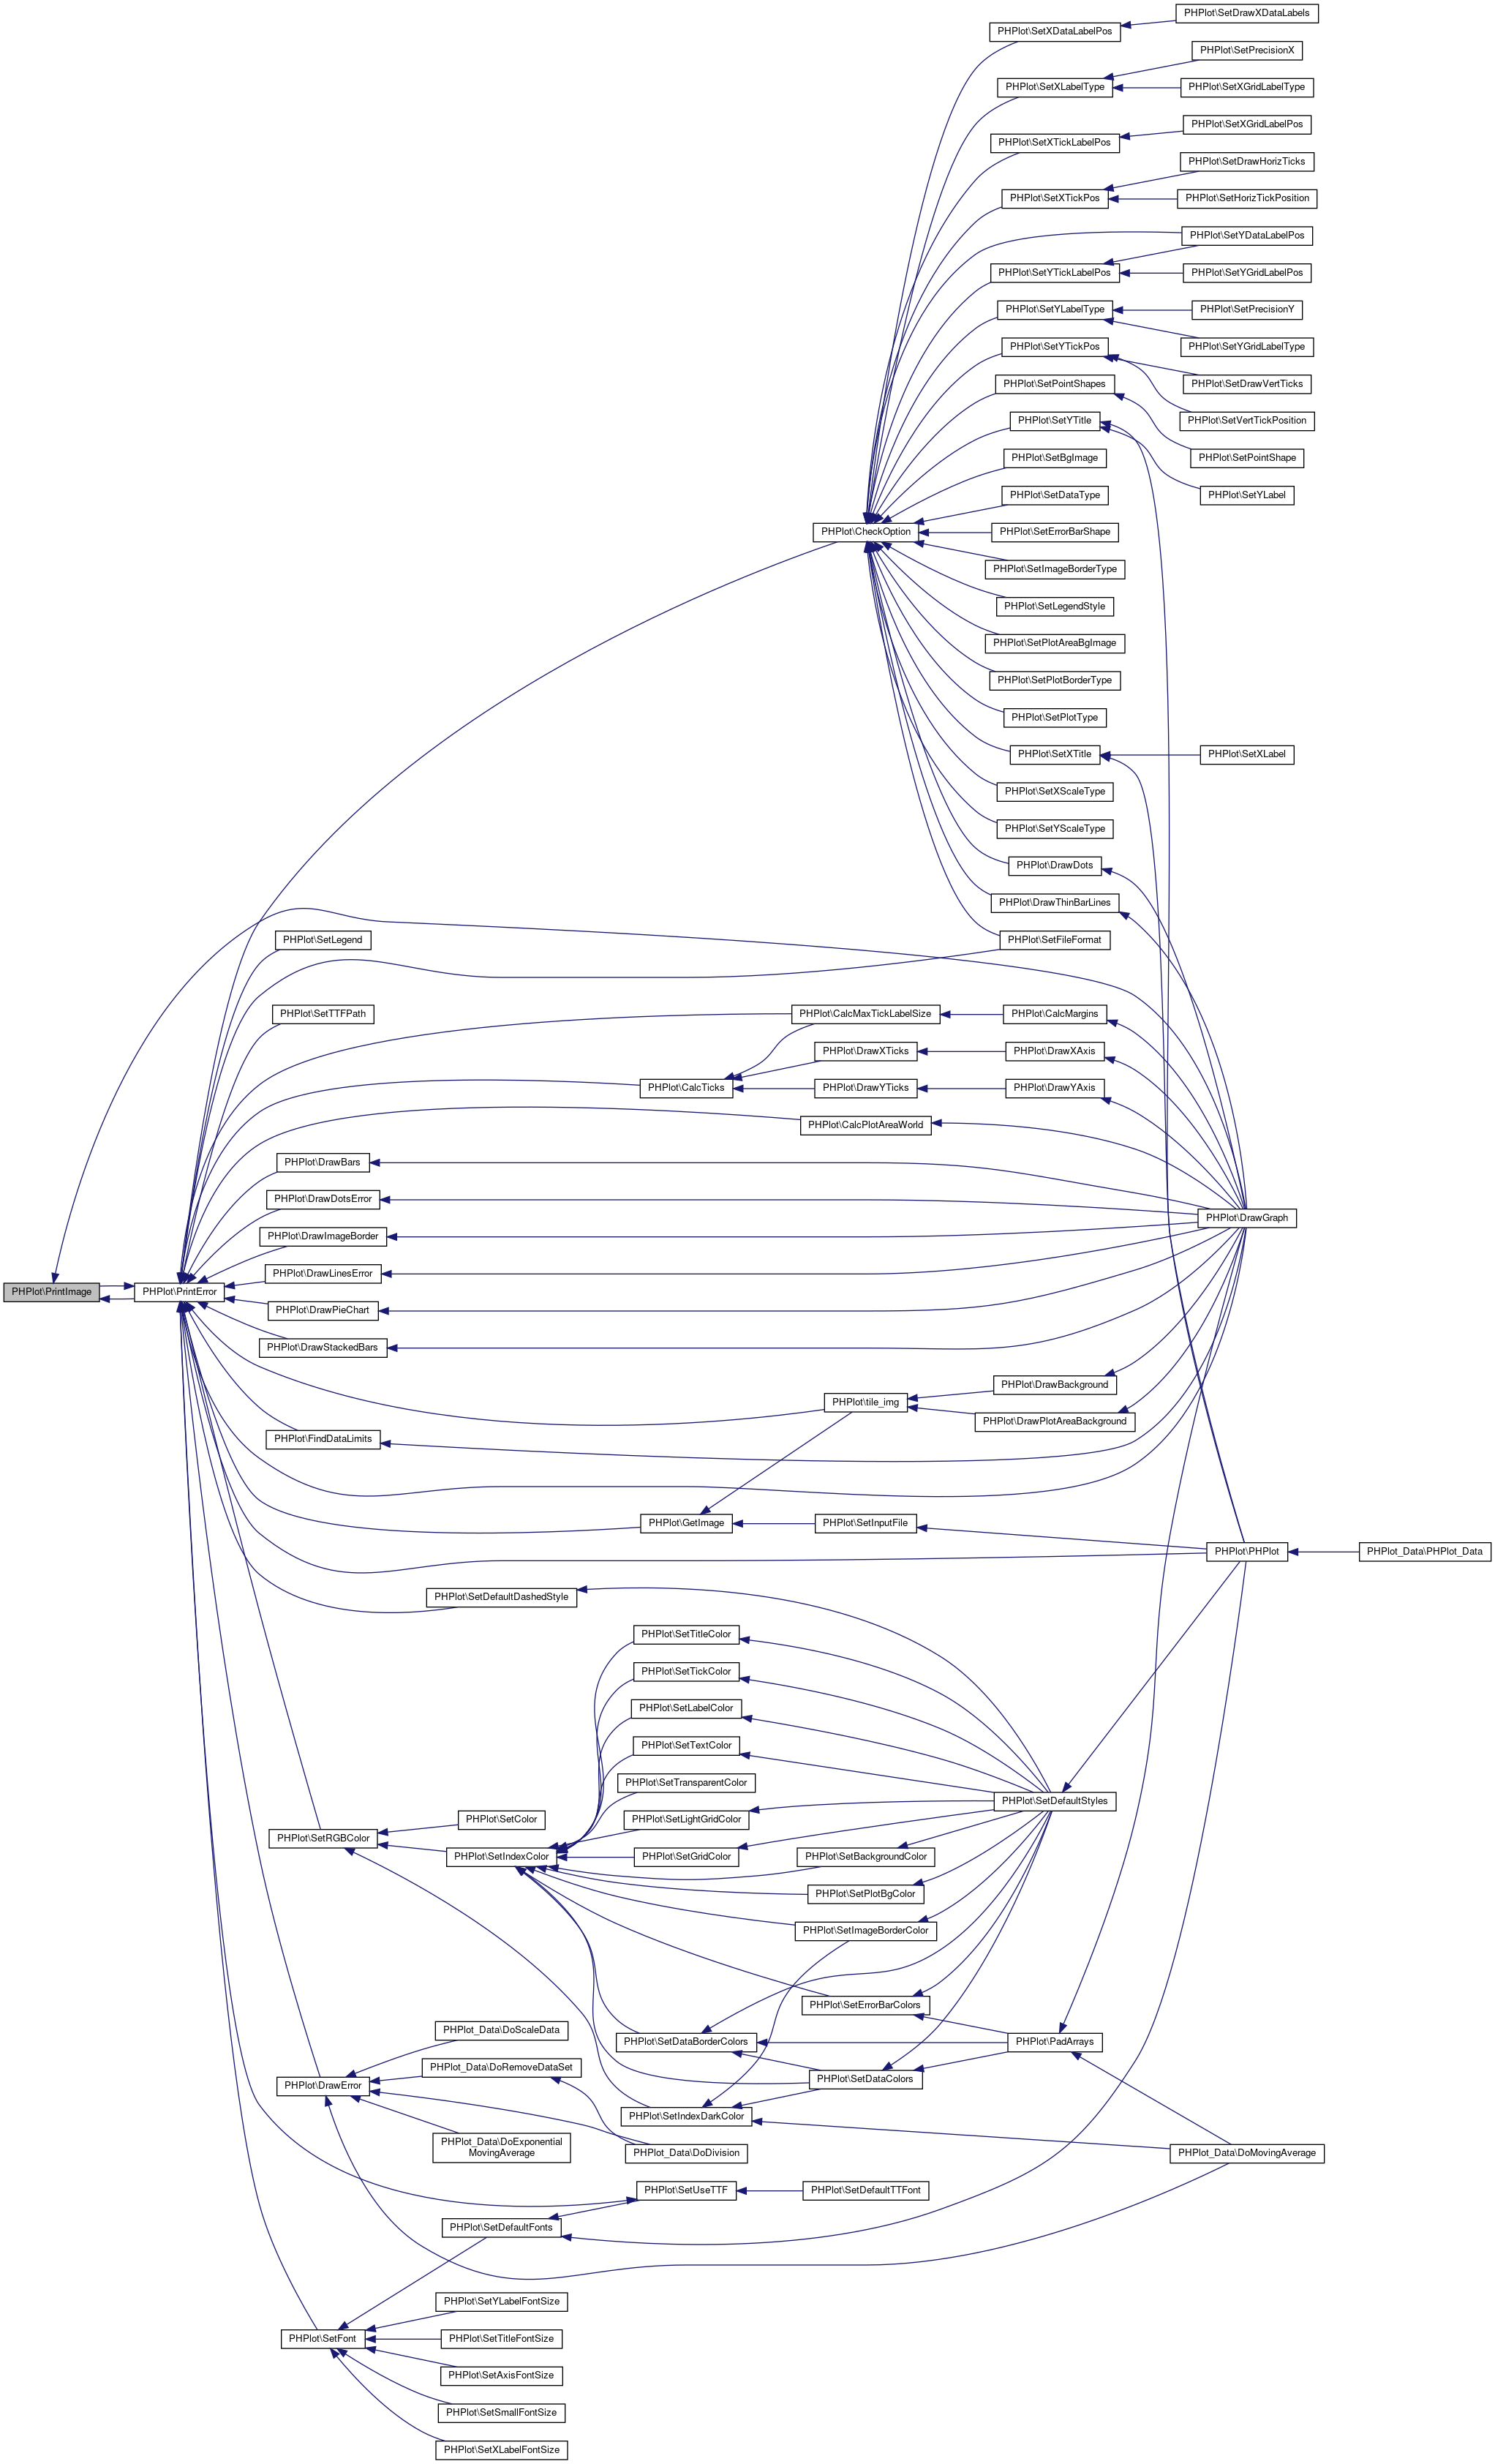
◆ ProcessText()
| PHPlot::ProcessText | ( | $draw_it, | |
| $font, | |||
| $angle, | |||
| $x, | |||
| $y, | |||
| $color, | |||
| $text, | |||
| $halign, | |||
| $valign | |||
| ) |
Definition at line 1278 of file phplot.php.
References ProcessTextGD(), and ProcessTextTTF().
Referenced by DrawText(), and SizeText().
Here is the call graph for this function: Here is the caller graph for this function:
◆ ProcessTextGD()
| PHPlot::ProcessTextGD | ( | $draw_it, | |
| $font_number, | |||
| $font_width, | |||
| $font_height, | |||
| $angle, | |||
| $x, | |||
| $y, | |||
| $color, | |||
| $text, | |||
| $h_factor, | |||
| $v_factor | |||
| ) |
Text drawing and sizing functions: ProcessText is meant for use only by DrawText and SizeText. ProcessText(True, ...) - Draw a block of text ProcessText(False, ...) - Just return ($width, $height) of the orthogonal bounding box containing the text. ProcessText is further split into separate functions for GD and TTF text, due to the size of the code.
Horizontal and vertical alignment are relative to the drawing. That is: vertical text (90 deg) gets centered along Y postition with v_align = 'center', and adjusted to the right of X position with h_align = 'right'. Another way to look at this is to say that text rotation happens first, then alignment.
Original multiple lines code submitted by Remi Ricard. Original vertical code submitted by Marlin Viss.
Text routines rewritten by ljb to fix alignment and position problems. Here is my explanation and notes. More information and pictures will be placed in the PHPlot Reference Manual.
- Process TTF text one line at a time, not as a block. (See below)
- Flipped top vs bottom vertical alignment. The usual interpretation is: bottom align means bottom of the text is at the specified Y coordinate. For some reason, PHPlot did left/right the correct way, but had top/bottom reversed. I fixed it, and left the default valign argument as bottom, but the meaning of the default value changed.
For GD font text, only single-line text is handled by GD, and the basepoint is the upper left corner of each text line. For TTF text, multi-line text could be handled by GD, with the text basepoint at the lower left corner of the first line of text. (Behavior of TTF drawing routines on multi-line text is not documented.) But you cannot do left/center/right alignment on each line that way, or proper line spacing. Therefore, for either text type, we have to break up the text into lines and position each line independently.
There are 9 alignment modes: Horizontal = left, center, or right, and Vertical = top, center, or bottom. Alignment is interpreted relative to the image, not as the text is read. This makes sense when you consider for example X axis labels. They need to be centered below the marks (center, top alignment) regardless of the text angle.
GD font text is supported (by libgd) at 0 degrees and 90 degrees only. Multi-line or single line text works with any of the 9 alignment modes.
TTF text can be at any angle. The 9 aligment modes work for all angles, but the results might not be what you expect for multi-line text. See the PHPlot Reference Manual for pictures and details. In short, alignment applies to the orthogonal (aligned with X and Y axes) bounding box that contains the text, and to each line in the multi-line text box. Since alignment is relative to the image, 45 degree multi-line text aligns differently from 46 degree text.
Note that PHPlot allows multi-line text for the 3 titles, and they are only drawn at 0 degrees (main and X titles) or 90 degrees (Y title). Data labels can also be multi-line, and they can be drawn at any angle. -ljb 2007-11-03
Definition at line 1003 of file phplot.php.
References $line_spacing, DoCallback(), and GetCallback().
Referenced by ProcessText().
Here is the call graph for this function: Here is the caller graph for this function:
◆ ProcessTextTTF()
| PHPlot::ProcessTextTTF | ( | $draw_it, | |
| $font_file, | |||
| $font_size, | |||
| $angle, | |||
| $x, | |||
| $y, | |||
| $color, | |||
| $text, | |||
| $h_factor, | |||
| $v_factor | |||
| ) |
Definition at line 1108 of file phplot.php.
References $line_widths, DoCallback(), and GetCallback().
Referenced by ProcessText().
Here is the call graph for this function: Here is the caller graph for this function:
◆ RemoveCallback()
| PHPlot::RemoveCallback | ( | $reason | ) |
Definition at line 2224 of file phplot.php.
◆ SetAxisFontSize()
| PHPlot::SetAxisFontSize | ( | $which_size | ) |
Definition at line 4868 of file phplot.php.
References SetFont().
Here is the call graph for this function:
◆ SetBackgroundColor()
| PHPlot::SetBackgroundColor | ( | $which_color | ) |
Definition at line 383 of file phplot.php.
References SetIndexColor().
Referenced by SetDefaultStyles().
Here is the call graph for this function: Here is the caller graph for this function:
◆ SetBgImage()
| PHPlot::SetBgImage | ( | $input_file, | |
$mode = 'centeredtile' |
|||
| ) |
Selects an input file to be used as graph background and scales or tiles this image to fit the sizes.
- Parameters
-
input_file string Path to the file to be used (jpeg, png and gif accepted) mode string 'centeredtile', 'tile', 'scale' (the image to the graph's size)
Definition at line 1380 of file phplot.php.
References CheckOption().
Here is the call graph for this function:
◆ SetBrowserCache()
| PHPlot::SetBrowserCache | ( | $which_browser_cache | ) |
- Note
- Submitted by Thiemo Nagel
Definition at line 1699 of file phplot.php.
◆ SetCallback()
| PHPlot::SetCallback | ( | $reason, | |
| $function, | |||
$arg = NULL |
|||
| ) |
Definition at line 2194 of file phplot.php.
◆ SetColor()
| PHPlot::SetColor | ( | $which_color | ) |
- Deprecated:
- Use _SetRGBColor()
Definition at line 5015 of file phplot.php.
References SetRGBColor().
Here is the call graph for this function:
◆ SetDashedStyle()
| PHPlot::SetDashedStyle | ( | $which_ndxcol | ) |
Sets the style before drawing a dashed line. Defaults to $this->default_dashed_style
- Parameters
-
which_ndxcol Color index to be used.
Definition at line 695 of file phplot.php.
Referenced by DrawLines(), DrawLinesError(), DrawSquared(), DrawXDataLine(), DrawXTicks(), and DrawYTicks().
Here is the caller graph for this function:
◆ SetDataBorderColors()
| PHPlot::SetDataBorderColors | ( | $which_br = NULL | ) |
Definition at line 608 of file phplot.php.
References SetIndexColor().
Referenced by PadArrays(), SetDataColors(), and SetDefaultStyles().
Here is the call graph for this function: Here is the caller graph for this function:
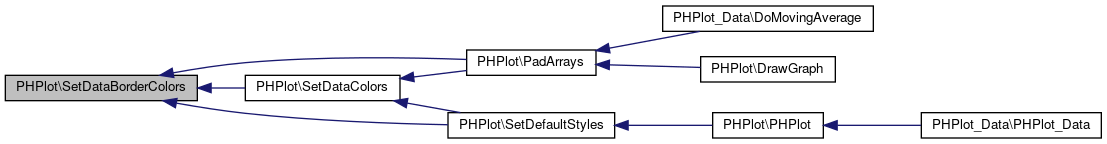
◆ SetDataColors()
| PHPlot::SetDataColors | ( | $which_data = NULL, |
|
$which_border = NULL |
|||
| ) |
Sets the colors for the data.
Definition at line 580 of file phplot.php.
References SetDataBorderColors(), SetIndexColor(), and SetIndexDarkColor().
Referenced by PadArrays(), and SetDefaultStyles().
Here is the call graph for this function: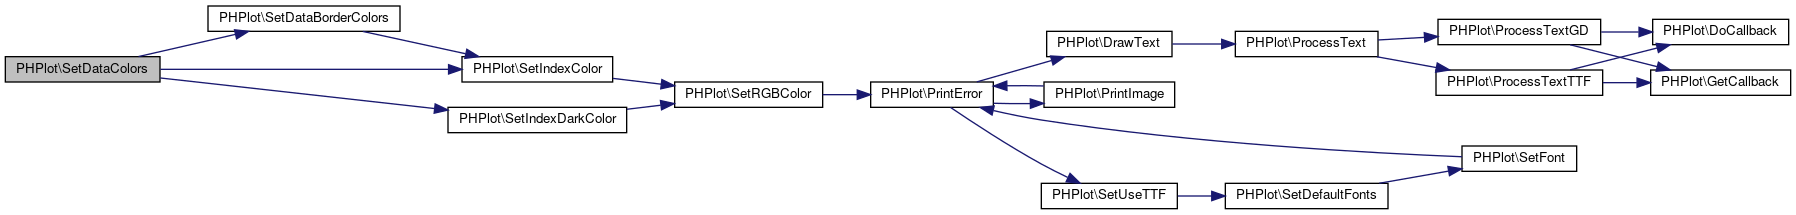 Here is the caller graph for this function:
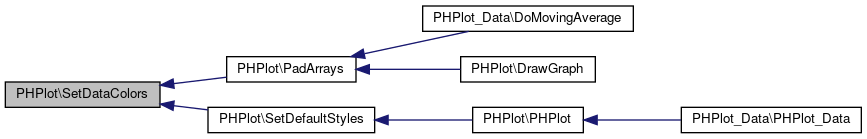
◆ SetDataType()
| PHPlot::SetDataType | ( | $which_dt | ) |
text-data: ('label', y1, y2, y3, ...) text-data-single: ('label', data), for some pie charts. data-data: ('label', x, y1, y2, y3, ...) data-data-error: ('label', x1, y1, e1+, e2-, y2, e2+, e2-, y3, e3+, e3-, ...)
Definition at line 2081 of file phplot.php.
References $data_type, and CheckOption().
Here is the call graph for this function:
◆ SetDataValues()
| PHPlot::SetDataValues | ( | & | $which_dv | ) |
Copy the array passed as data values. We convert to numerical indexes, for its use for (or while) loops, which sometimes are faster. Performance improvements vary from 28% in DrawLines() to 49% in DrawArea() for plot drawing functions.
Definition at line 2100 of file phplot.php.
◆ SetDefaultDashedStyle()
| PHPlot::SetDefaultDashedStyle | ( | $which_style | ) |
Sets the default dashed style.
- Parameters
-
which_style A string specifying order of colored and transparent dots, i.e: '4-3' means 4 colored, 3 transparent; '2-3-1-2' means 2 colored, 3 transparent, 1 colored, 2 transparent.
Definition at line 662 of file phplot.php.
References $t, and PrintError().
Referenced by SetDefaultStyles().
Here is the call graph for this function: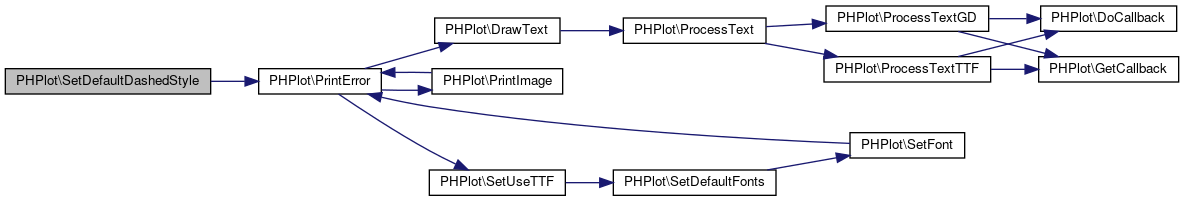 Here is the caller graph for this function:
◆ SetDefaultFonts()
| PHPlot::SetDefaultFonts | ( | ) |
Sets fonts to their defaults
Definition at line 792 of file phplot.php.
References SetFont().
Referenced by PHPlot(), and SetUseTTF().
Here is the call graph for this function: Here is the caller graph for this function:
◆ SetDefaultStyles()
| PHPlot::SetDefaultStyles | ( | ) |
Sets/reverts all colors and styles to their defaults. If session is set, then only updates indices, as they are lost with every script execution, else, sets the default colors by name or value and then updates indices too.
FIXME Isn't this too slow?
Definition at line 347 of file phplot.php.
References SetBackgroundColor(), SetDataBorderColors(), SetDataColors(), SetDefaultDashedStyle(), SetErrorBarColors(), SetGridColor(), SetImageBorderColor(), SetLabelColor(), SetLightGridColor(), SetLineStyles(), SetLineWidths(), SetPlotBgColor(), SetPointSizes(), SetTextColor(), SetTickColor(), and SetTitleColor().
Referenced by PHPlot().
Here is the call graph for this function: Here is the caller graph for this function:
◆ SetDefaultTTFont()
| PHPlot::SetDefaultTTFont | ( | $which_font | ) |
Sets the default TrueType font and updates all fonts to that. The default font might be a full path, or relative to the TTFPath, so let SetFont check that it exists. Side effect: enable use of TrueType fonts.
Definition at line 783 of file phplot.php.
References SetUseTTF().
Here is the call graph for this function:
◆ SetDrawBrokenLines()
| PHPlot::SetDrawBrokenLines | ( | $bl | ) |
Tells not to draw lines for missing Y data. Only works with 'lines' and 'squared' plots.
- Parameters
-
bl bool
Definition at line 2068 of file phplot.php.
◆ SetDrawDashedGrid()
| PHPlot::SetDrawDashedGrid | ( | $ddg | ) |
- Parameters
-
ddg bool
Definition at line 1828 of file phplot.php.
◆ SetDrawHorizTicks()
| PHPlot::SetDrawHorizTicks | ( | $which_dht | ) |
Deprecated, use SetXTickPos()
Definition at line 4801 of file phplot.php.
References SetXTickPos().
Here is the call graph for this function:
◆ SetDrawPlotAreaBackground()
| PHPlot::SetDrawPlotAreaBackground | ( | $dpab | ) |
- Parameters
-
dpab bool
Definition at line 1798 of file phplot.php.
◆ SetDrawVertTicks()
| PHPlot::SetDrawVertTicks | ( | $which_dvt | ) |
Deprecated, use SetYTickPos()
Definition at line 4791 of file phplot.php.
References SetYTickPos().
Here is the call graph for this function: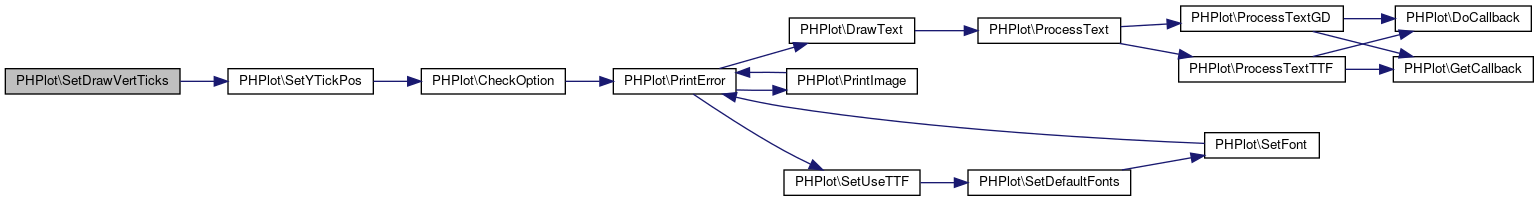
◆ SetDrawXDataLabelLines()
| PHPlot::SetDrawXDataLabelLines | ( | $dxdl | ) |
- Parameters
-
dxdl bool
Definition at line 1838 of file phplot.php.
◆ SetDrawXDataLabels()
| PHPlot::SetDrawXDataLabels | ( | $which_dxdl | ) |
Draw Labels (not grid labels) on X Axis, following data points. Default position is down of plot. Care must be taken not to draw these and x_tick_labels as they'd probably overlap.
Definition at line 4987 of file phplot.php.
References SetXDataLabelPos().
Here is the call graph for this function: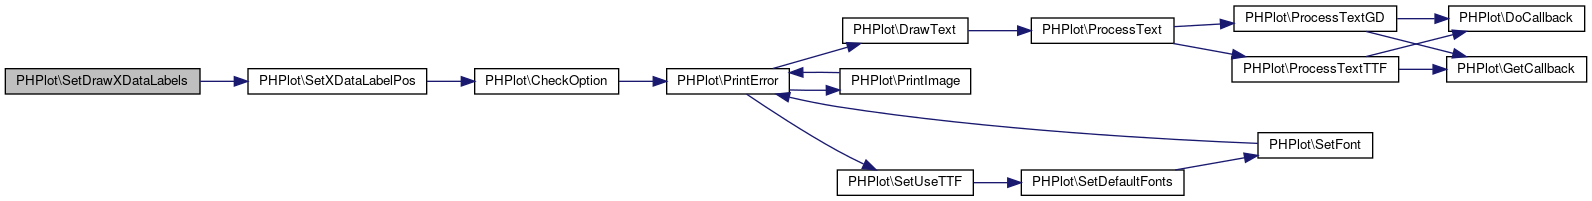
◆ SetDrawXGrid()
| PHPlot::SetDrawXGrid | ( | $dxg | ) |
- Parameters
-
dxg bool
Definition at line 1818 of file phplot.php.
◆ SetDrawYDataLabelLines()
| PHPlot::SetDrawYDataLabelLines | ( | $dydl | ) |
TODO: draw_y_data_label_lines not implemented.
- Parameters
-
dydl bool
Definition at line 1849 of file phplot.php.
◆ SetDrawYGrid()
| PHPlot::SetDrawYGrid | ( | $dyg | ) |
- Parameters
-
dyg bool
Definition at line 1808 of file phplot.php.
◆ SetErrorBarColors()
| PHPlot::SetErrorBarColors | ( | $which_err = NULL | ) |
Sets the colors for the data error bars.
Definition at line 634 of file phplot.php.
References SetIndexColor().
Referenced by PadArrays(), and SetDefaultStyles().
Here is the call graph for this function: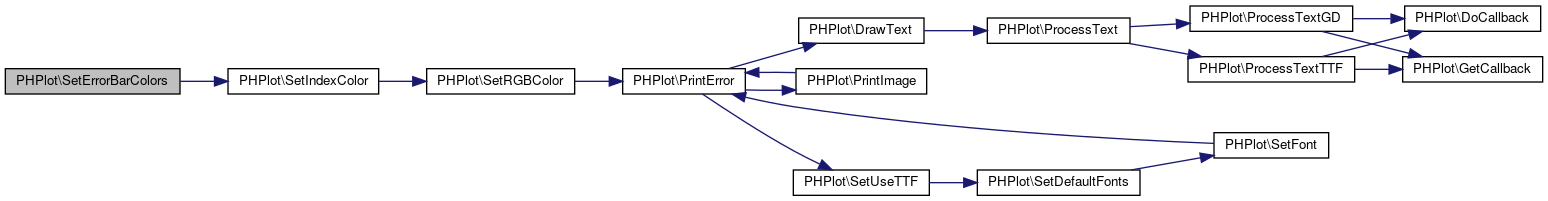 Here is the caller graph for this function:
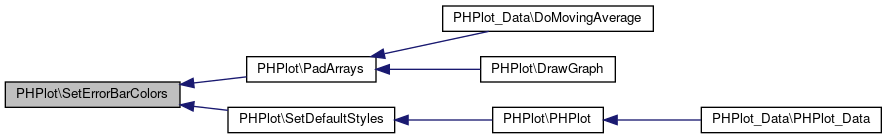
◆ SetErrorBarLineWidth()
| PHPlot::SetErrorBarLineWidth | ( | $which_seblw | ) |
Definition at line 1959 of file phplot.php.
Referenced by SetLineWidth().
Here is the caller graph for this function:
◆ SetErrorBarShape()
| PHPlot::SetErrorBarShape | ( | $which_ebs | ) |
Can be one of: 'tee', 'line'
Definition at line 1982 of file phplot.php.
References $error_bar_shape, and CheckOption().
Here is the call graph for this function:
◆ SetErrorBarSize()
| PHPlot::SetErrorBarSize | ( | $which_ebs | ) |
Definition at line 1972 of file phplot.php.
◆ SetFileFormat()
| PHPlot::SetFileFormat | ( | $format | ) |
Sets output file format.
Definition at line 1348 of file phplot.php.
References CheckOption(), and PrintError().
Here is the call graph for this function: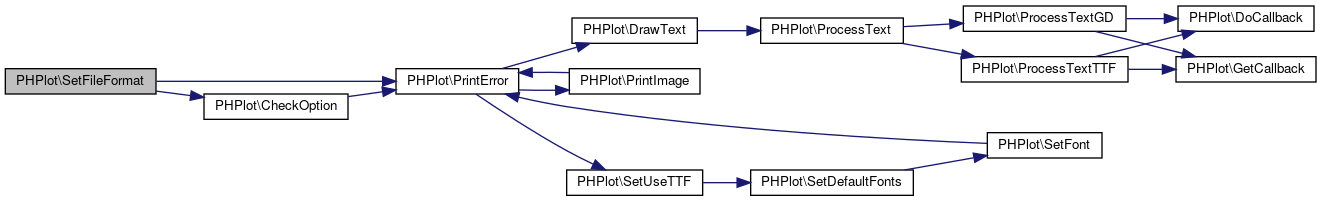
◆ SetFont()
| PHPlot::SetFont | ( | $which_elem, | |
| $which_font, | |||
$which_size = 12 |
|||
| ) |
Sets Fixed/Truetype font parameters.
- Parameters
-
$which_elem Is the element whose font is to be changed. It can be one of 'title', 'legend', 'generic', 'x_label', 'y_label', x_title' or 'y_title' $which_font Can be a number (for fixed font sizes) or a string with the font pathname or filename when using TTFonts. For TTFonts, an empty string means use the default font. $which_size Point size (TTF only) Calculates and updates internal height and width variables.
Definition at line 825 of file phplot.php.
References $default_ttfont, $path, and PrintError().
Referenced by SetAxisFontSize(), SetDefaultFonts(), SetSmallFontSize(), SetTitleFontSize(), SetXLabelFontSize(), and SetYLabelFontSize().
Here is the call graph for this function: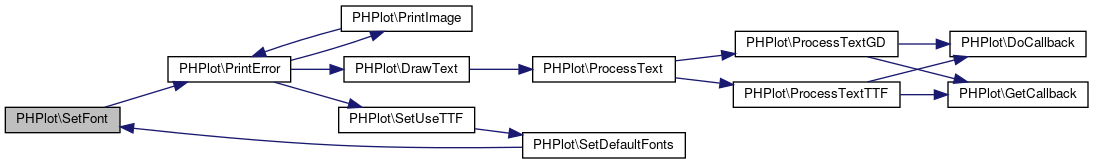 Here is the caller graph for this function:
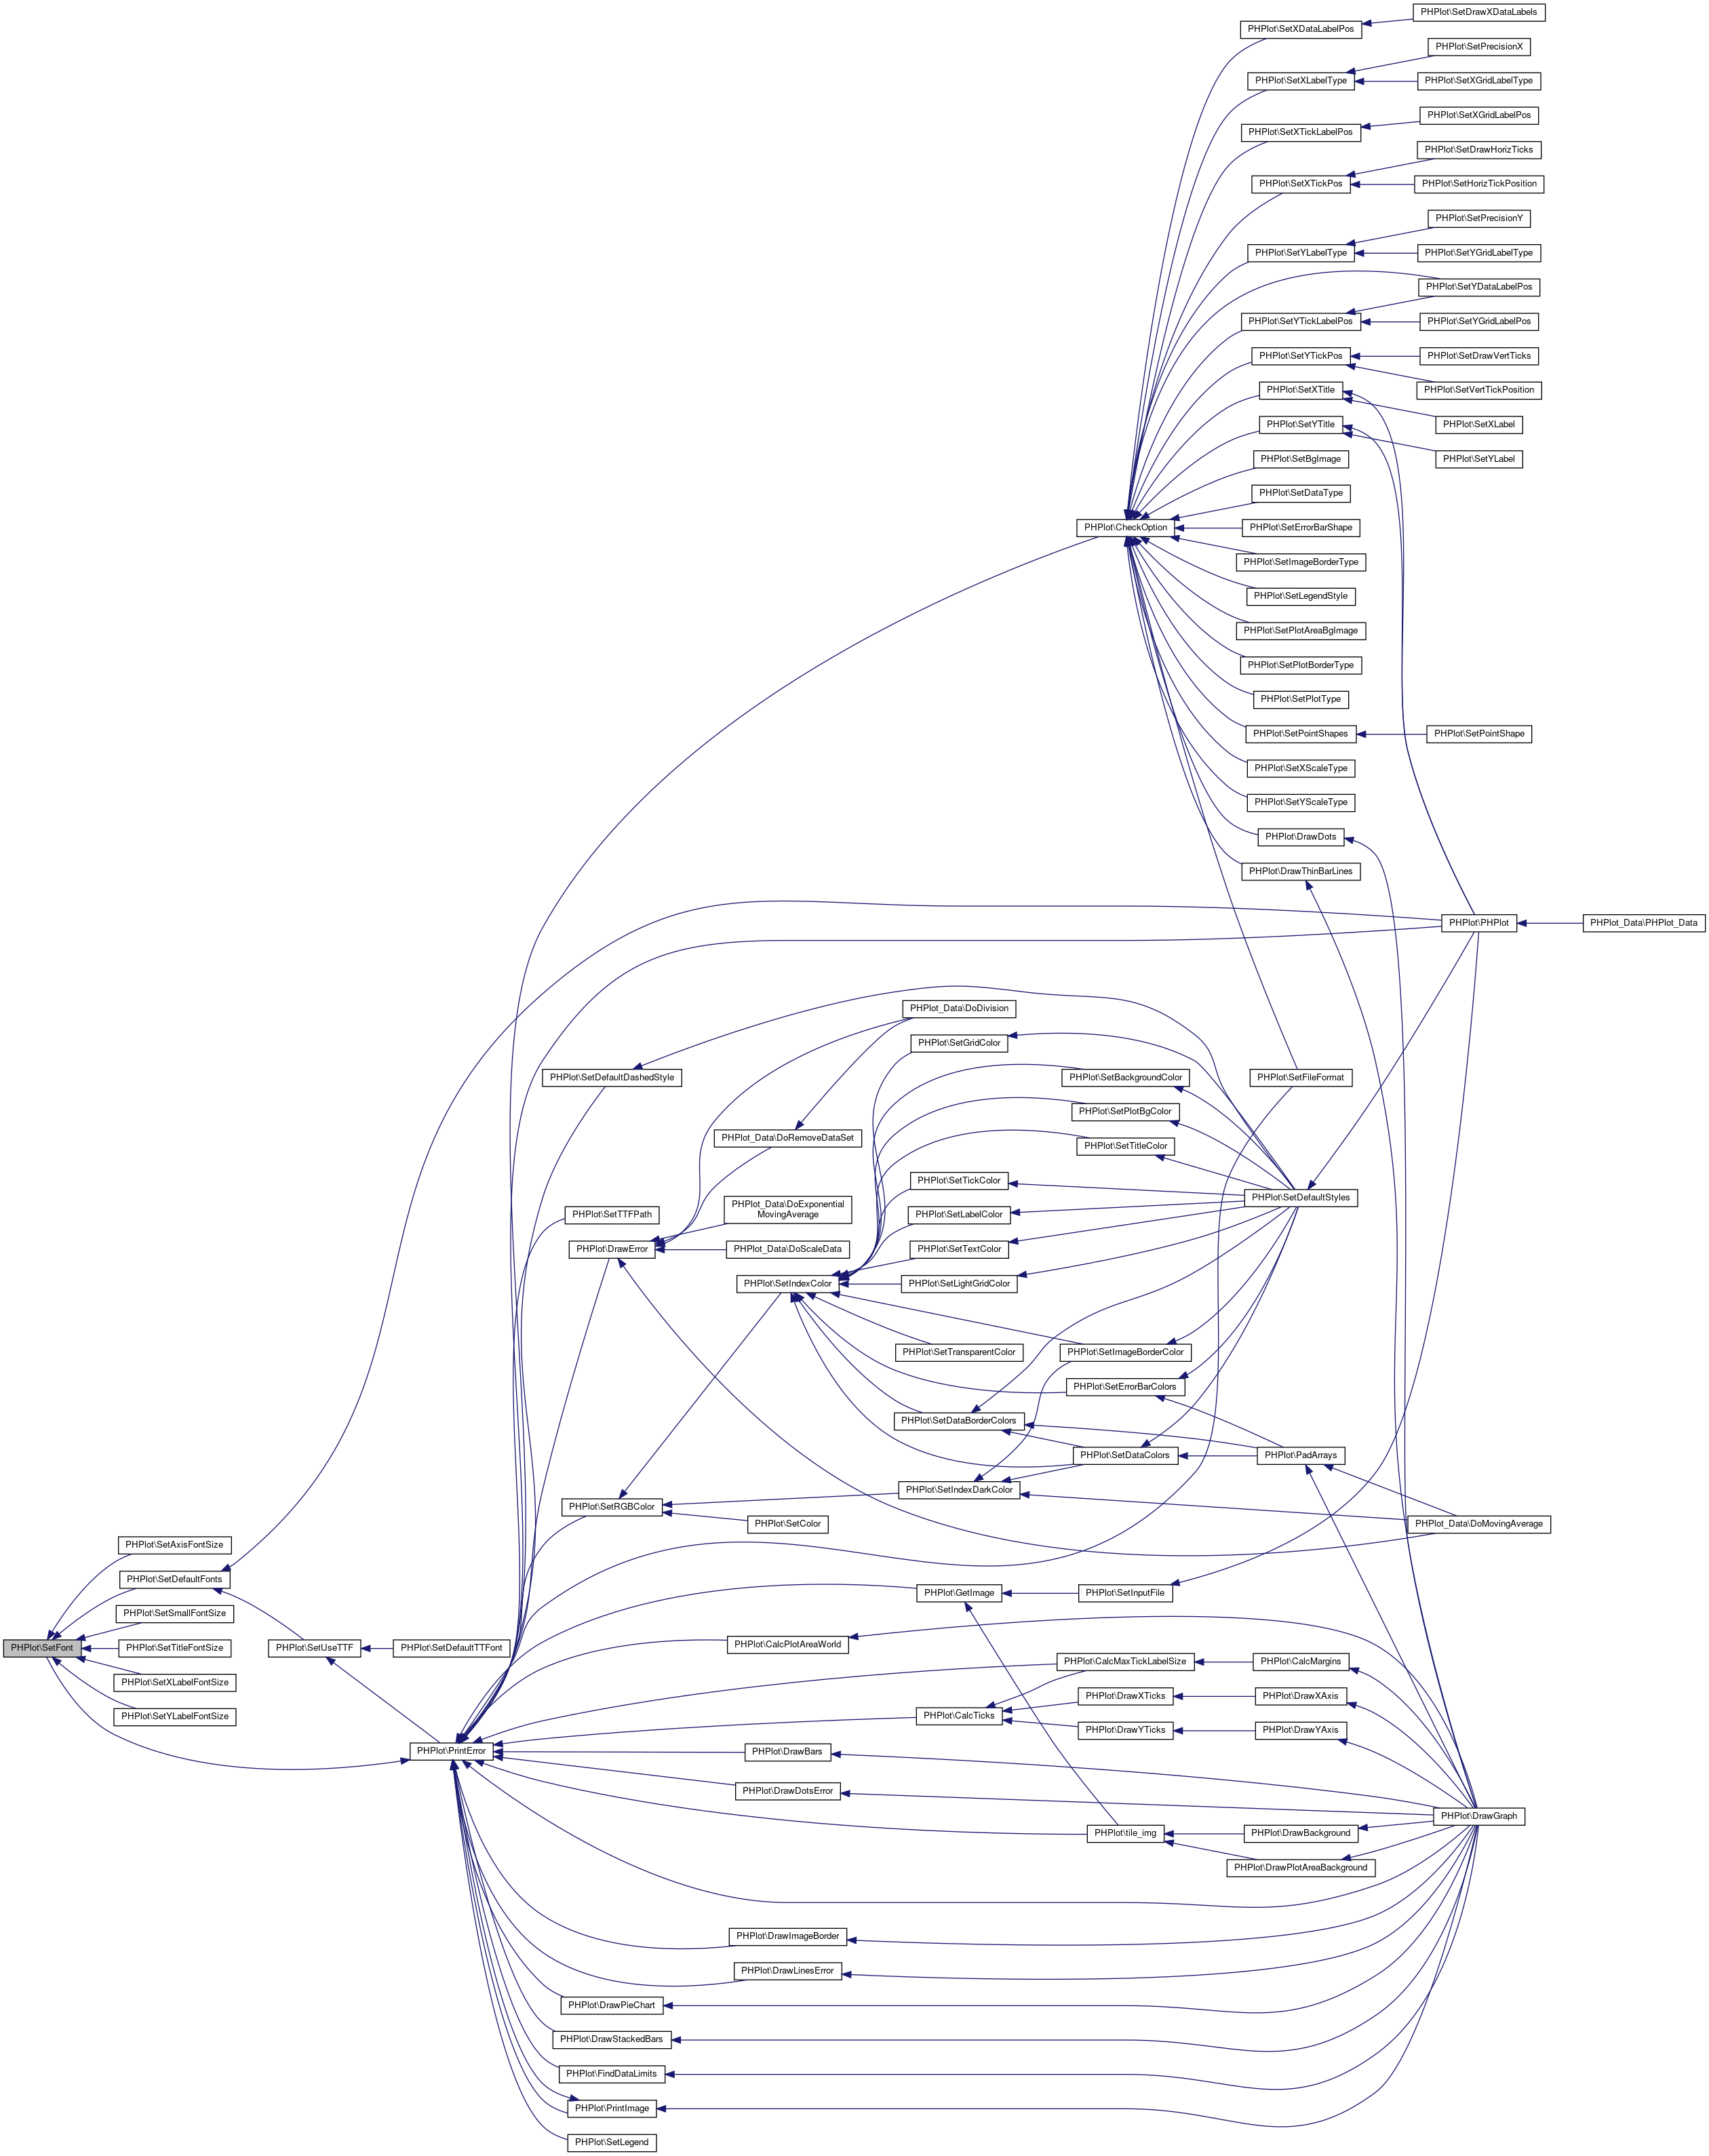
◆ SetGridColor()
| PHPlot::SetGridColor | ( | $which_color | ) |
Definition at line 457 of file phplot.php.
References SetIndexColor().
Referenced by SetDefaultStyles().
Here is the call graph for this function: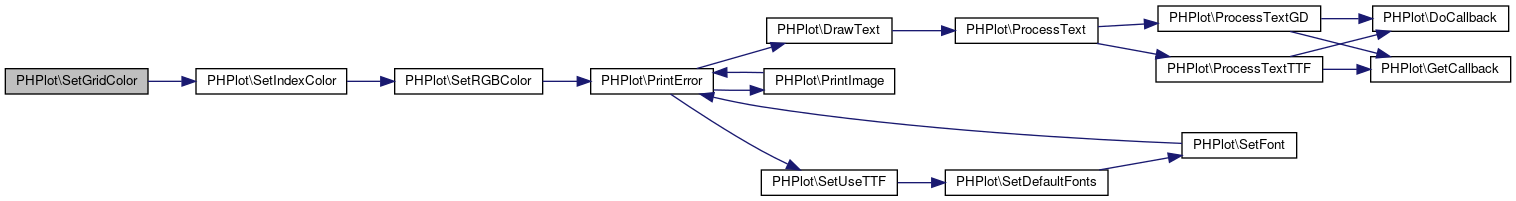 Here is the caller graph for this function:
◆ SetHorizTickIncrement()
| PHPlot::SetHorizTickIncrement | ( | $inc | ) |
Definition at line 4827 of file phplot.php.
References SetXTickIncrement().
Here is the call graph for this function:
◆ SetHorizTickPosition()
| PHPlot::SetHorizTickPosition | ( | $which_tp | ) |
Definition at line 4852 of file phplot.php.
References SetXTickPos().
Here is the call graph for this function: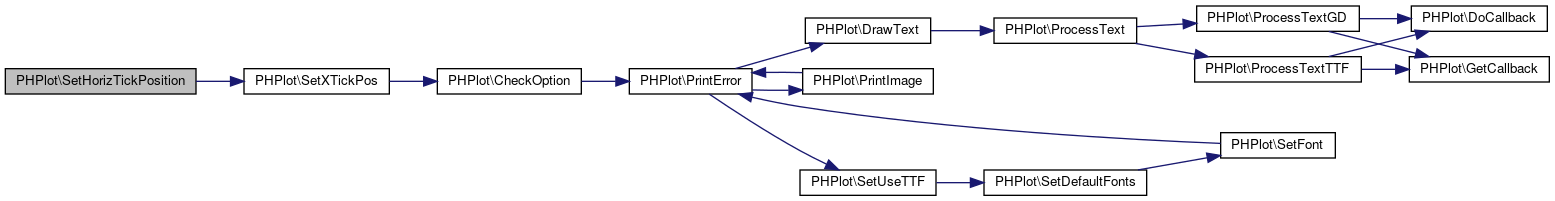
◆ SetImageBorderColor()
| PHPlot::SetImageBorderColor | ( | $which_color | ) |
Definition at line 468 of file phplot.php.
References SetIndexColor(), and SetIndexDarkColor().
Referenced by SetDefaultStyles().
Here is the call graph for this function: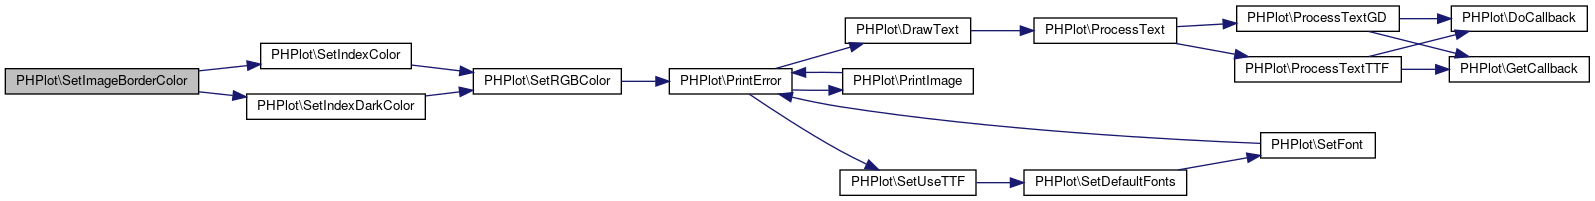 Here is the caller graph for this function:
◆ SetImageBorderType()
| PHPlot::SetImageBorderType | ( | $sibt | ) |
Accepted values are: raised, plain
Definition at line 1788 of file phplot.php.
References $image_border_type, and CheckOption().
Here is the call graph for this function:
◆ SetIndexColor()
| PHPlot::SetIndexColor | ( | $which_color | ) |
Returns an index to a color passed in as anything (string, hex, rgb)
- Parameters
-
which_color * Color (can be '#AABBCC', 'Colorname', or array(r,g,b)) Returns a GD color index (integer >= 0), or NULL on error.
Definition at line 317 of file phplot.php.
References SetRGBColor().
Referenced by SetBackgroundColor(), SetDataBorderColors(), SetDataColors(), SetErrorBarColors(), SetGridColor(), SetImageBorderColor(), SetLabelColor(), SetLightGridColor(), SetPlotBgColor(), SetTextColor(), SetTickColor(), SetTitleColor(), and SetTransparentColor().
Here is the call graph for this function: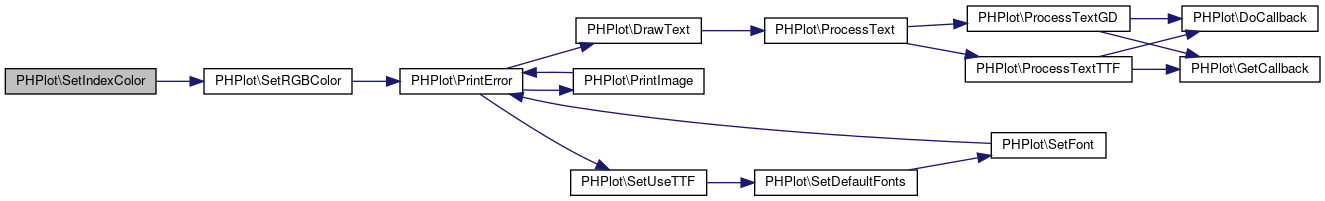 Here is the caller graph for this function:
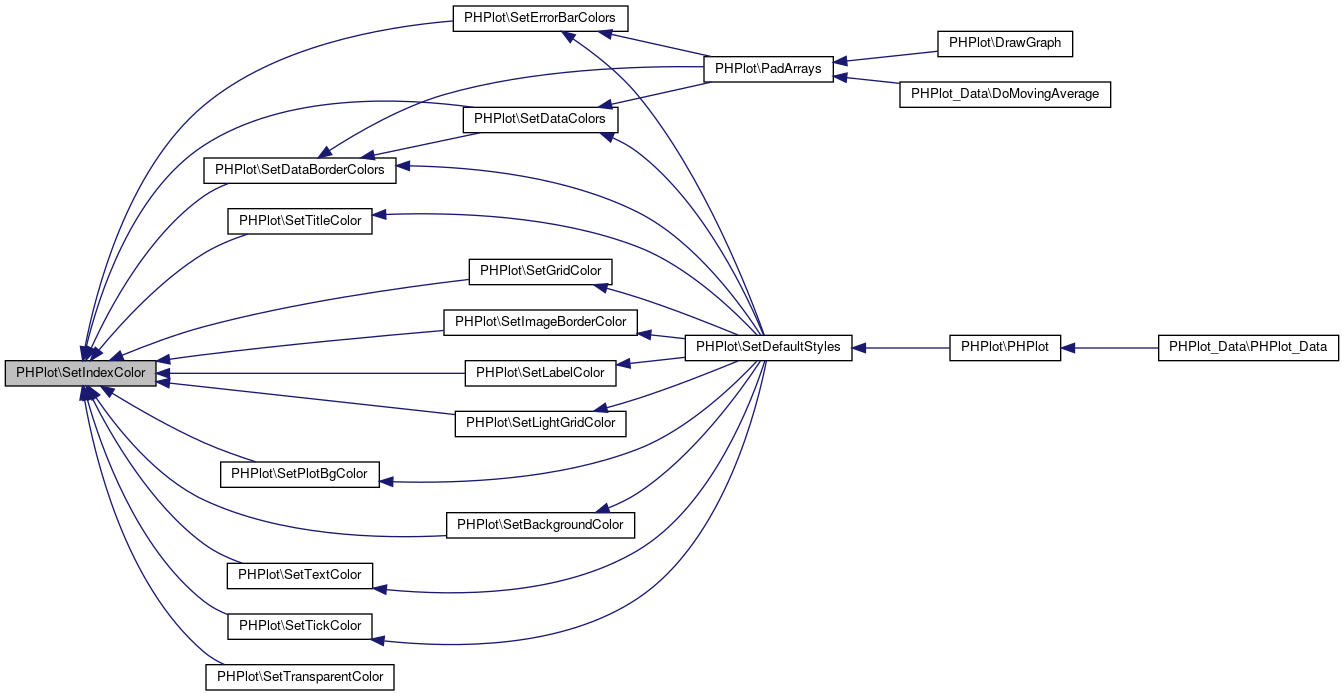
◆ SetIndexDarkColor()
| PHPlot::SetIndexDarkColor | ( | $which_color | ) |
Returns an index to a slightly darker color than the one requested. Returns a GD color index (integer >= 0), or NULL on error.
Definition at line 329 of file phplot.php.
References SetRGBColor().
Referenced by PHPlot_Data\DoMovingAverage(), SetDataColors(), and SetImageBorderColor().
Here is the call graph for this function: Here is the caller graph for this function:
◆ SetInputFile()
| PHPlot::SetInputFile | ( | $which_input_file | ) |
Selects an input file to be used as background for the whole graph. This resets the graph size to the image's size. Note: This is used by the constructor. It is deprecated for direct use.
Definition at line 289 of file phplot.php.
References GetImage().
Referenced by PHPlot().
Here is the call graph for this function: Here is the caller graph for this function:
◆ SetIsInline()
| PHPlot::SetIsInline | ( | $which_ii | ) |
Sets the output image as 'inline', that is: no Content-Type headers are sent to the browser. Needed if you want to embed the images.
Definition at line 1414 of file phplot.php.
◆ SetLabelColor()
| PHPlot::SetLabelColor | ( | $which_color | ) |
Definition at line 424 of file phplot.php.
References SetIndexColor().
Referenced by SetDefaultStyles().
Here is the call graph for this function: Here is the caller graph for this function:
◆ SetLabelScalePosition()
| PHPlot::SetLabelScalePosition | ( | $which_blp | ) |
Definition at line 1965 of file phplot.php.
◆ SetLegend()
| PHPlot::SetLegend | ( | $which_leg | ) |
Sets the graph's legend. If argument is not an array, appends it to the legend.
Definition at line 1717 of file phplot.php.
References PrintError().
Here is the call graph for this function:
◆ SetLegendPixels()
| PHPlot::SetLegendPixels | ( | $which_x, | |
| $which_y | |||
| ) |
Specifies the position of the legend's upper/leftmost corner, in pixel (device) coordinates.
Definition at line 1733 of file phplot.php.
◆ SetLegendStyle()
| PHPlot::SetLegendStyle | ( | $text_align, | |
$colorbox_align = '', |
|||
$style = '' |
|||
| ) |
Definition at line 1766 of file phplot.php.
References CheckOption().
Here is the call graph for this function:
◆ SetLegendWorld()
| PHPlot::SetLegendWorld | ( | $which_x, | |
| $which_y | |||
| ) |
Specifies the position of the legend's upper/leftmost corner, in world (data space) coordinates. Since the scale factor to convert world to pixel coordinates is probably not available, set a flag and defer conversion to later.
Definition at line 1750 of file phplot.php.
◆ SetLightGridColor()
| PHPlot::SetLightGridColor | ( | $which_color | ) |
Definition at line 446 of file phplot.php.
References SetIndexColor().
Referenced by SetDefaultStyles().
Here is the call graph for this function: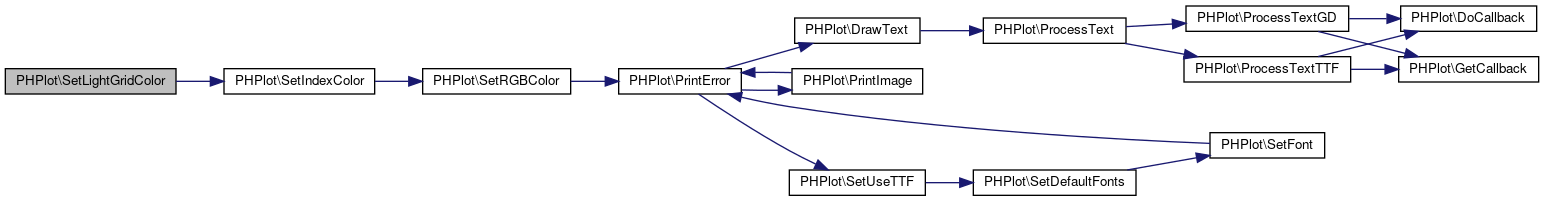 Here is the caller graph for this function:
◆ SetLineSpacing()
| PHPlot::SetLineSpacing | ( | $which_spc | ) |
Sets number of pixels between lines of the same text.
Definition at line 744 of file phplot.php.
◆ SetLineStyles()
| PHPlot::SetLineStyles | ( | $which_ls = NULL | ) |
Definition at line 722 of file phplot.php.
Referenced by SetDefaultStyles().
Here is the caller graph for this function:
◆ SetLineWidth()
| PHPlot::SetLineWidth | ( | $which_lw | ) |
Definition at line 5024 of file phplot.php.
References SetErrorBarLineWidth(), and SetLineWidths().
Here is the call graph for this function: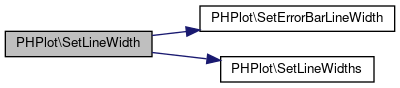
◆ SetLineWidths()
| PHPlot::SetLineWidths | ( | $which_lw = NULL | ) |
Sets line widths on a per-line basis.
Definition at line 706 of file phplot.php.
Referenced by SetDefaultStyles(), and SetLineWidth().
Here is the caller graph for this function: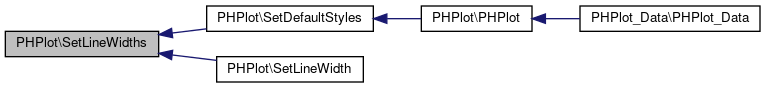
◆ SetMarginsPixels()
| PHPlot::SetMarginsPixels | ( | $which_lm, | |
| $which_rm, | |||
| $which_tm, | |||
| $which_bm | |||
| ) |
Set the margins in pixels (left, right, top, bottom) This determines the plot area, equivalent to SetPlotAreaPixels(). Deferred calculations now occur in CalcPlotAreaPixels().
Definition at line 2665 of file phplot.php.
◆ SetNewPlotAreaPixels()
| PHPlot::SetNewPlotAreaPixels | ( | $x1, | |
| $y1, | |||
| $x2, | |||
| $y2 | |||
| ) |
Definition at line 4998 of file phplot.php.
References CalcTranslation().
Here is the call graph for this function: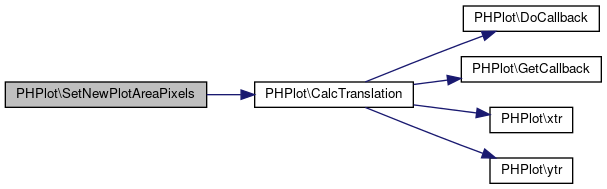
◆ SetNumberFormat()
| PHPlot::SetNumberFormat | ( | $decimal_point, | |
| $thousands_sep | |||
| ) |
Definition at line 1650 of file phplot.php.
◆ SetNumHorizTicks()
| PHPlot::SetNumHorizTicks | ( | $n | ) |
Definition at line 4811 of file phplot.php.
References $n, and SetNumXTicks().
Here is the call graph for this function:
◆ SetNumVertTicks()
| PHPlot::SetNumVertTicks | ( | $n | ) |
Definition at line 4819 of file phplot.php.
References $n, and SetNumYTicks().
Here is the call graph for this function:
◆ SetNumXTicks()
| PHPlot::SetNumXTicks | ( | $which_nt | ) |
Definition at line 3138 of file phplot.php.
Referenced by SetNumHorizTicks().
Here is the caller graph for this function:
◆ SetNumYTicks()
| PHPlot::SetNumYTicks | ( | $which_nt | ) |
Definition at line 3147 of file phplot.php.
Referenced by SetNumVertTicks().
Here is the caller graph for this function:
◆ SetOutputFile()
| PHPlot::SetOutputFile | ( | $which_output_file | ) |
Sets the name of the file to be used as output file.
Definition at line 1404 of file phplot.php.
Referenced by PHPlot().
Here is the caller graph for this function:
◆ SetPlotAreaBgImage()
| PHPlot::SetPlotAreaBgImage | ( | $input_file, | |
$mode = 'tile' |
|||
| ) |
Selects an input file to be used as plot area background and scales or tiles this image to fit the sizes.
- Parameters
-
input_file string Path to the file to be used (jpeg, png and gif accepted) mode string 'centeredtile', 'tile', 'scale' (the image to the graph's size)
Definition at line 1393 of file phplot.php.
References CheckOption().
Here is the call graph for this function: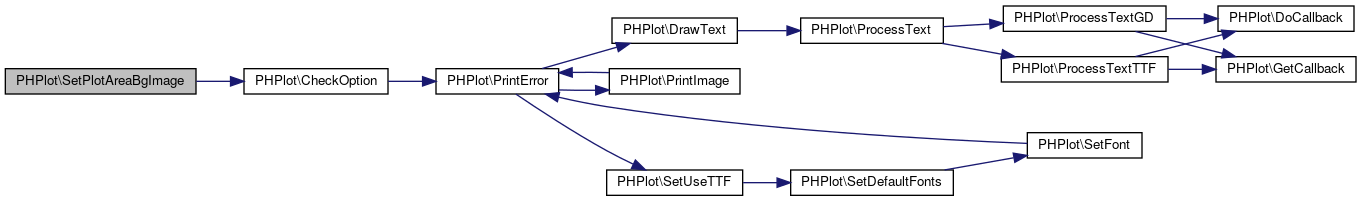
◆ SetPlotAreaPixels()
| PHPlot::SetPlotAreaPixels | ( | $x1, | |
| $y1, | |||
| $x2, | |||
| $y2 | |||
| ) |
Sets the limits for the plot area. This stores the margins, not the area. That may seem odd, but the idea is to make SetPlotAreaPixels and SetMarginsPixels two ways to accomplish the same thing, and the deferred calculations in CalcMargins and CalcPlotAreaPixels don't need to know which was used. (x1, y1) - Upper left corner of the plot area (x2, y2) - Lower right corner of the plot area
Definition at line 2687 of file phplot.php.
◆ SetPlotAreaWorld()
| PHPlot::SetPlotAreaWorld | ( | $xmin = NULL, |
|
$ymin = NULL, |
|||
$xmax = NULL, |
|||
$ymax = NULL |
|||
| ) |
Stores the desired World Coordinate range of the plot. The user calls this to force one or more of the range limits to specific values. Anything not set will be calculated in CalcPlotAreaWorld().
Definition at line 2772 of file phplot.php.
◆ SetPlotBgColor()
| PHPlot::SetPlotBgColor | ( | $which_color | ) |
Definition at line 393 of file phplot.php.
References SetIndexColor().
Referenced by SetDefaultStyles().
Here is the call graph for this function: Here is the caller graph for this function:
◆ SetPlotBorderType()
| PHPlot::SetPlotBorderType | ( | $pbt | ) |
Accepted values are: left, sides, none, full
Definition at line 1779 of file phplot.php.
References $plot_border_type, and CheckOption().
Here is the call graph for this function:
◆ SetPlotType()
| PHPlot::SetPlotType | ( | $which_pt | ) |
Definition at line 1904 of file phplot.php.
References $plot_type, and CheckOption().
Here is the call graph for this function: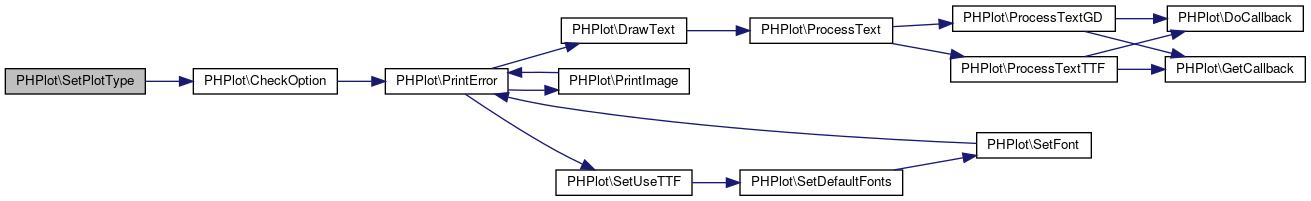
◆ SetPointShape()
| PHPlot::SetPointShape | ( | $which_pt | ) |
Definition at line 5038 of file phplot.php.
References SetPointShapes().
Here is the call graph for this function: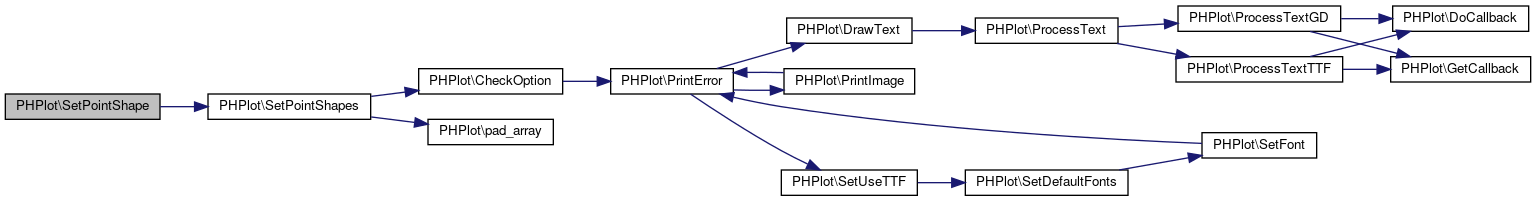
◆ SetPointShapes()
| PHPlot::SetPointShapes | ( | $which_pt | ) |
Sets point shape for each data set via an array. Shape can be one of: 'halfline', 'line', 'plus', 'cross', 'rect', 'circle', 'dot', 'diamond', 'triangle', 'trianglemid', or 'none'.
Definition at line 1993 of file phplot.php.
References CheckOption(), and pad_array().
Referenced by SetPointShape().
Here is the call graph for this function: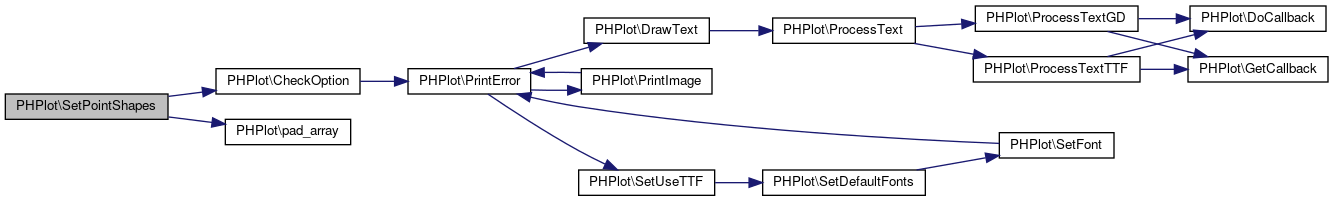 Here is the caller graph for this function:
◆ SetPointSize()
| PHPlot::SetPointSize | ( | $which_ps | ) |
Definition at line 5047 of file phplot.php.
References SetPointSizes().
Here is the call graph for this function:
◆ SetPointSizes()
| PHPlot::SetPointSizes | ( | $which_ps | ) |
Sets the point size for point plots.
- Parameters
-
ps int Size in pixels.
- Note
- Test this more extensively
Definition at line 2030 of file phplot.php.
References pad_array().
Referenced by SetDefaultStyles(), and SetPointSize().
Here is the call graph for this function: Here is the caller graph for this function:
◆ SetPrecisionX()
| PHPlot::SetPrecisionX | ( | $which_prec | ) |
Definition at line 1945 of file phplot.php.
References SetXLabelType().
Here is the call graph for this function: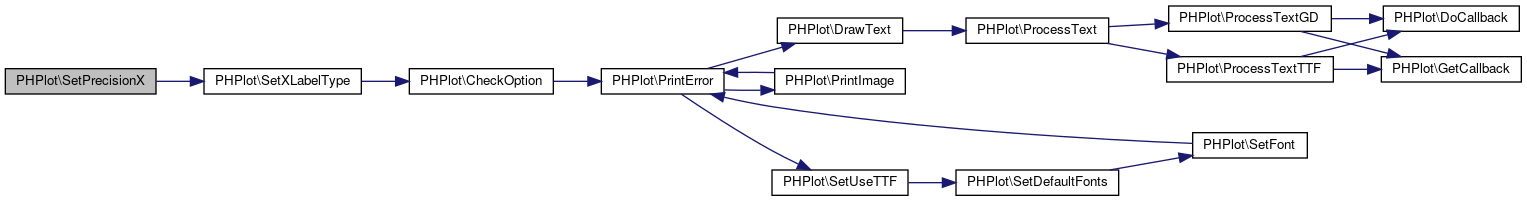
◆ SetPrecisionY()
| PHPlot::SetPrecisionY | ( | $which_prec | ) |
Definition at line 1952 of file phplot.php.
References SetYLabelType().
Here is the call graph for this function:
◆ SetPrintImage()
| PHPlot::SetPrintImage | ( | $which_pi | ) |
Whether to show the final image or not
Definition at line 1708 of file phplot.php.
◆ SetRGBArray()
| PHPlot::SetRGBArray | ( | $which_color_array | ) |
Sets the array of colors to be used. It can be user defined, a small predefined one or a large one included from 'rgb.inc.php'.
- Parameters
-
which_color_array If an array, the used as color array. If a string can be one of 'small' or 'large'.
Definition at line 497 of file phplot.php.
Referenced by PHPlot().
Here is the caller graph for this function:
◆ SetRGBColor()
| PHPlot::SetRGBColor | ( | $color_asked | ) |
Returns an array in R, G, B format 0-255
- Parameters
-
color_asked array(R,G,B) or string (named color or '#AABBCC')
Definition at line 557 of file phplot.php.
References PrintError().
Referenced by SetColor(), SetIndexColor(), and SetIndexDarkColor().
Here is the call graph for this function: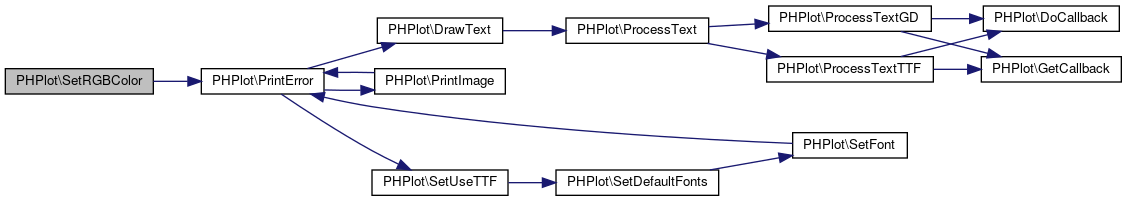 Here is the caller graph for this function:
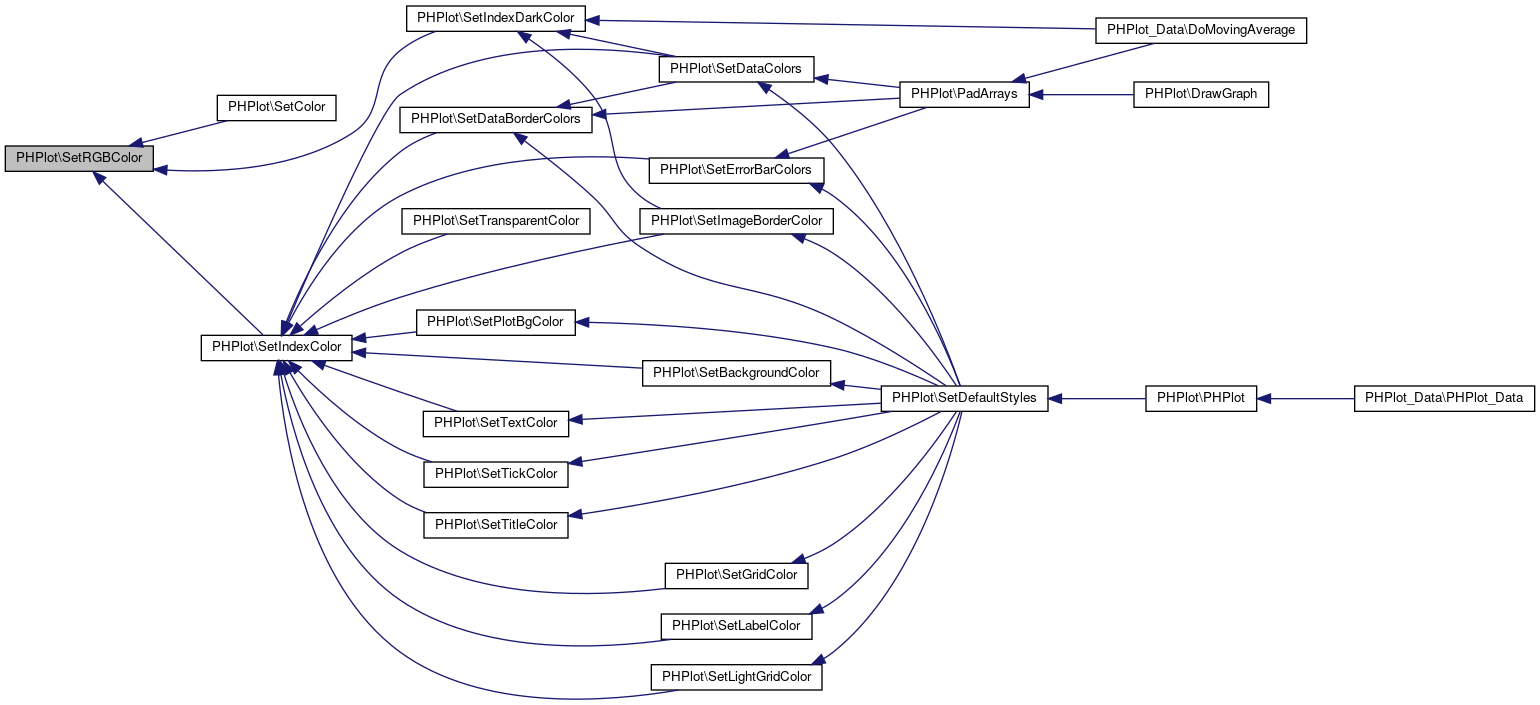
◆ SetShading()
| PHPlot::SetShading | ( | $which_s | ) |
Sets the size of the drop shadow for bar and pie charts.
- Parameters
-
which_s int Size in pixels.
Definition at line 1898 of file phplot.php.
◆ SetSkipBottomTick()
| PHPlot::SetSkipBottomTick | ( | $skip | ) |
- Parameters
-
skip bool
Definition at line 3185 of file phplot.php.
◆ SetSkipLeftTick()
| PHPlot::SetSkipLeftTick | ( | $skip | ) |
- Parameters
-
skip bool
Definition at line 3194 of file phplot.php.
◆ SetSkipRightTick()
| PHPlot::SetSkipRightTick | ( | $skip | ) |
- Parameters
-
skip bool
Definition at line 3203 of file phplot.php.
◆ SetSkipTopTick()
| PHPlot::SetSkipTopTick | ( | $skip | ) |
- Parameters
-
skip bool
Definition at line 3176 of file phplot.php.
◆ SetSmallFontSize()
| PHPlot::SetSmallFontSize | ( | $which_size | ) |
Definition at line 4877 of file phplot.php.
References SetFont().
Here is the call graph for this function: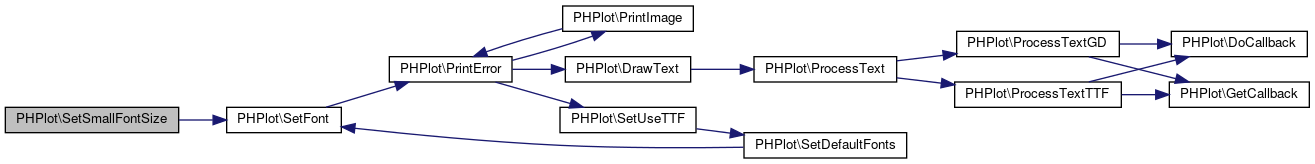
◆ SetTextColor()
| PHPlot::SetTextColor | ( | $which_color | ) |
Definition at line 435 of file phplot.php.
References SetIndexColor().
Referenced by SetDefaultStyles().
Here is the call graph for this function: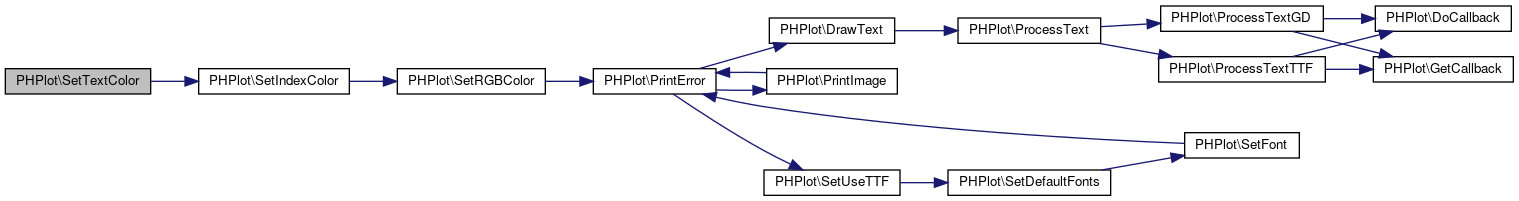 Here is the caller graph for this function:
◆ SetTickColor()
| PHPlot::SetTickColor | ( | $which_color | ) |
Definition at line 413 of file phplot.php.
References SetIndexColor().
Referenced by SetDefaultStyles().
Here is the call graph for this function: Here is the caller graph for this function:
◆ SetTickLength()
| PHPlot::SetTickLength | ( | $which_tl | ) |
- Deprecated:
- Use SetXTickLength() and SetYTickLength() instead.
Definition at line 4917 of file phplot.php.
References SetXTickLength(), and SetYTickLength().
Here is the call graph for this function: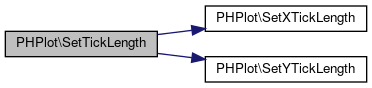
◆ SetTitle()
| PHPlot::SetTitle | ( | $which_title | ) |
Sets the graph's title. TODO: add parameter to choose title placement: left, right, centered=
Definition at line 1859 of file phplot.php.
Referenced by PHPlot().
Here is the caller graph for this function:
◆ SetTitleColor()
| PHPlot::SetTitleColor | ( | $which_color | ) |
Definition at line 403 of file phplot.php.
References SetIndexColor().
Referenced by SetDefaultStyles().
Here is the call graph for this function: Here is the caller graph for this function:
◆ SetTitleFontSize()
| PHPlot::SetTitleFontSize | ( | $which_size | ) |
Definition at line 4860 of file phplot.php.
References SetFont().
Here is the call graph for this function:
◆ SetTransparentColor()
| PHPlot::SetTransparentColor | ( | $which_color | ) |
Definition at line 480 of file phplot.php.
References SetIndexColor().
Here is the call graph for this function:
◆ SetTTFPath()
| PHPlot::SetTTFPath | ( | $which_path | ) |
Sets the directory name to look into for TrueType fonts.
Definition at line 765 of file phplot.php.
References PrintError().
Here is the call graph for this function:
◆ SetUseTTF()
| PHPlot::SetUseTTF | ( | $which_ttf | ) |
Enables use of TrueType fonts in the graph. Font initialisation methods depend on this setting, so when called, SetUseTTF() resets the font settings
Definition at line 756 of file phplot.php.
References SetDefaultFonts().
Referenced by PrintError(), and SetDefaultTTFont().
Here is the call graph for this function: Here is the caller graph for this function:
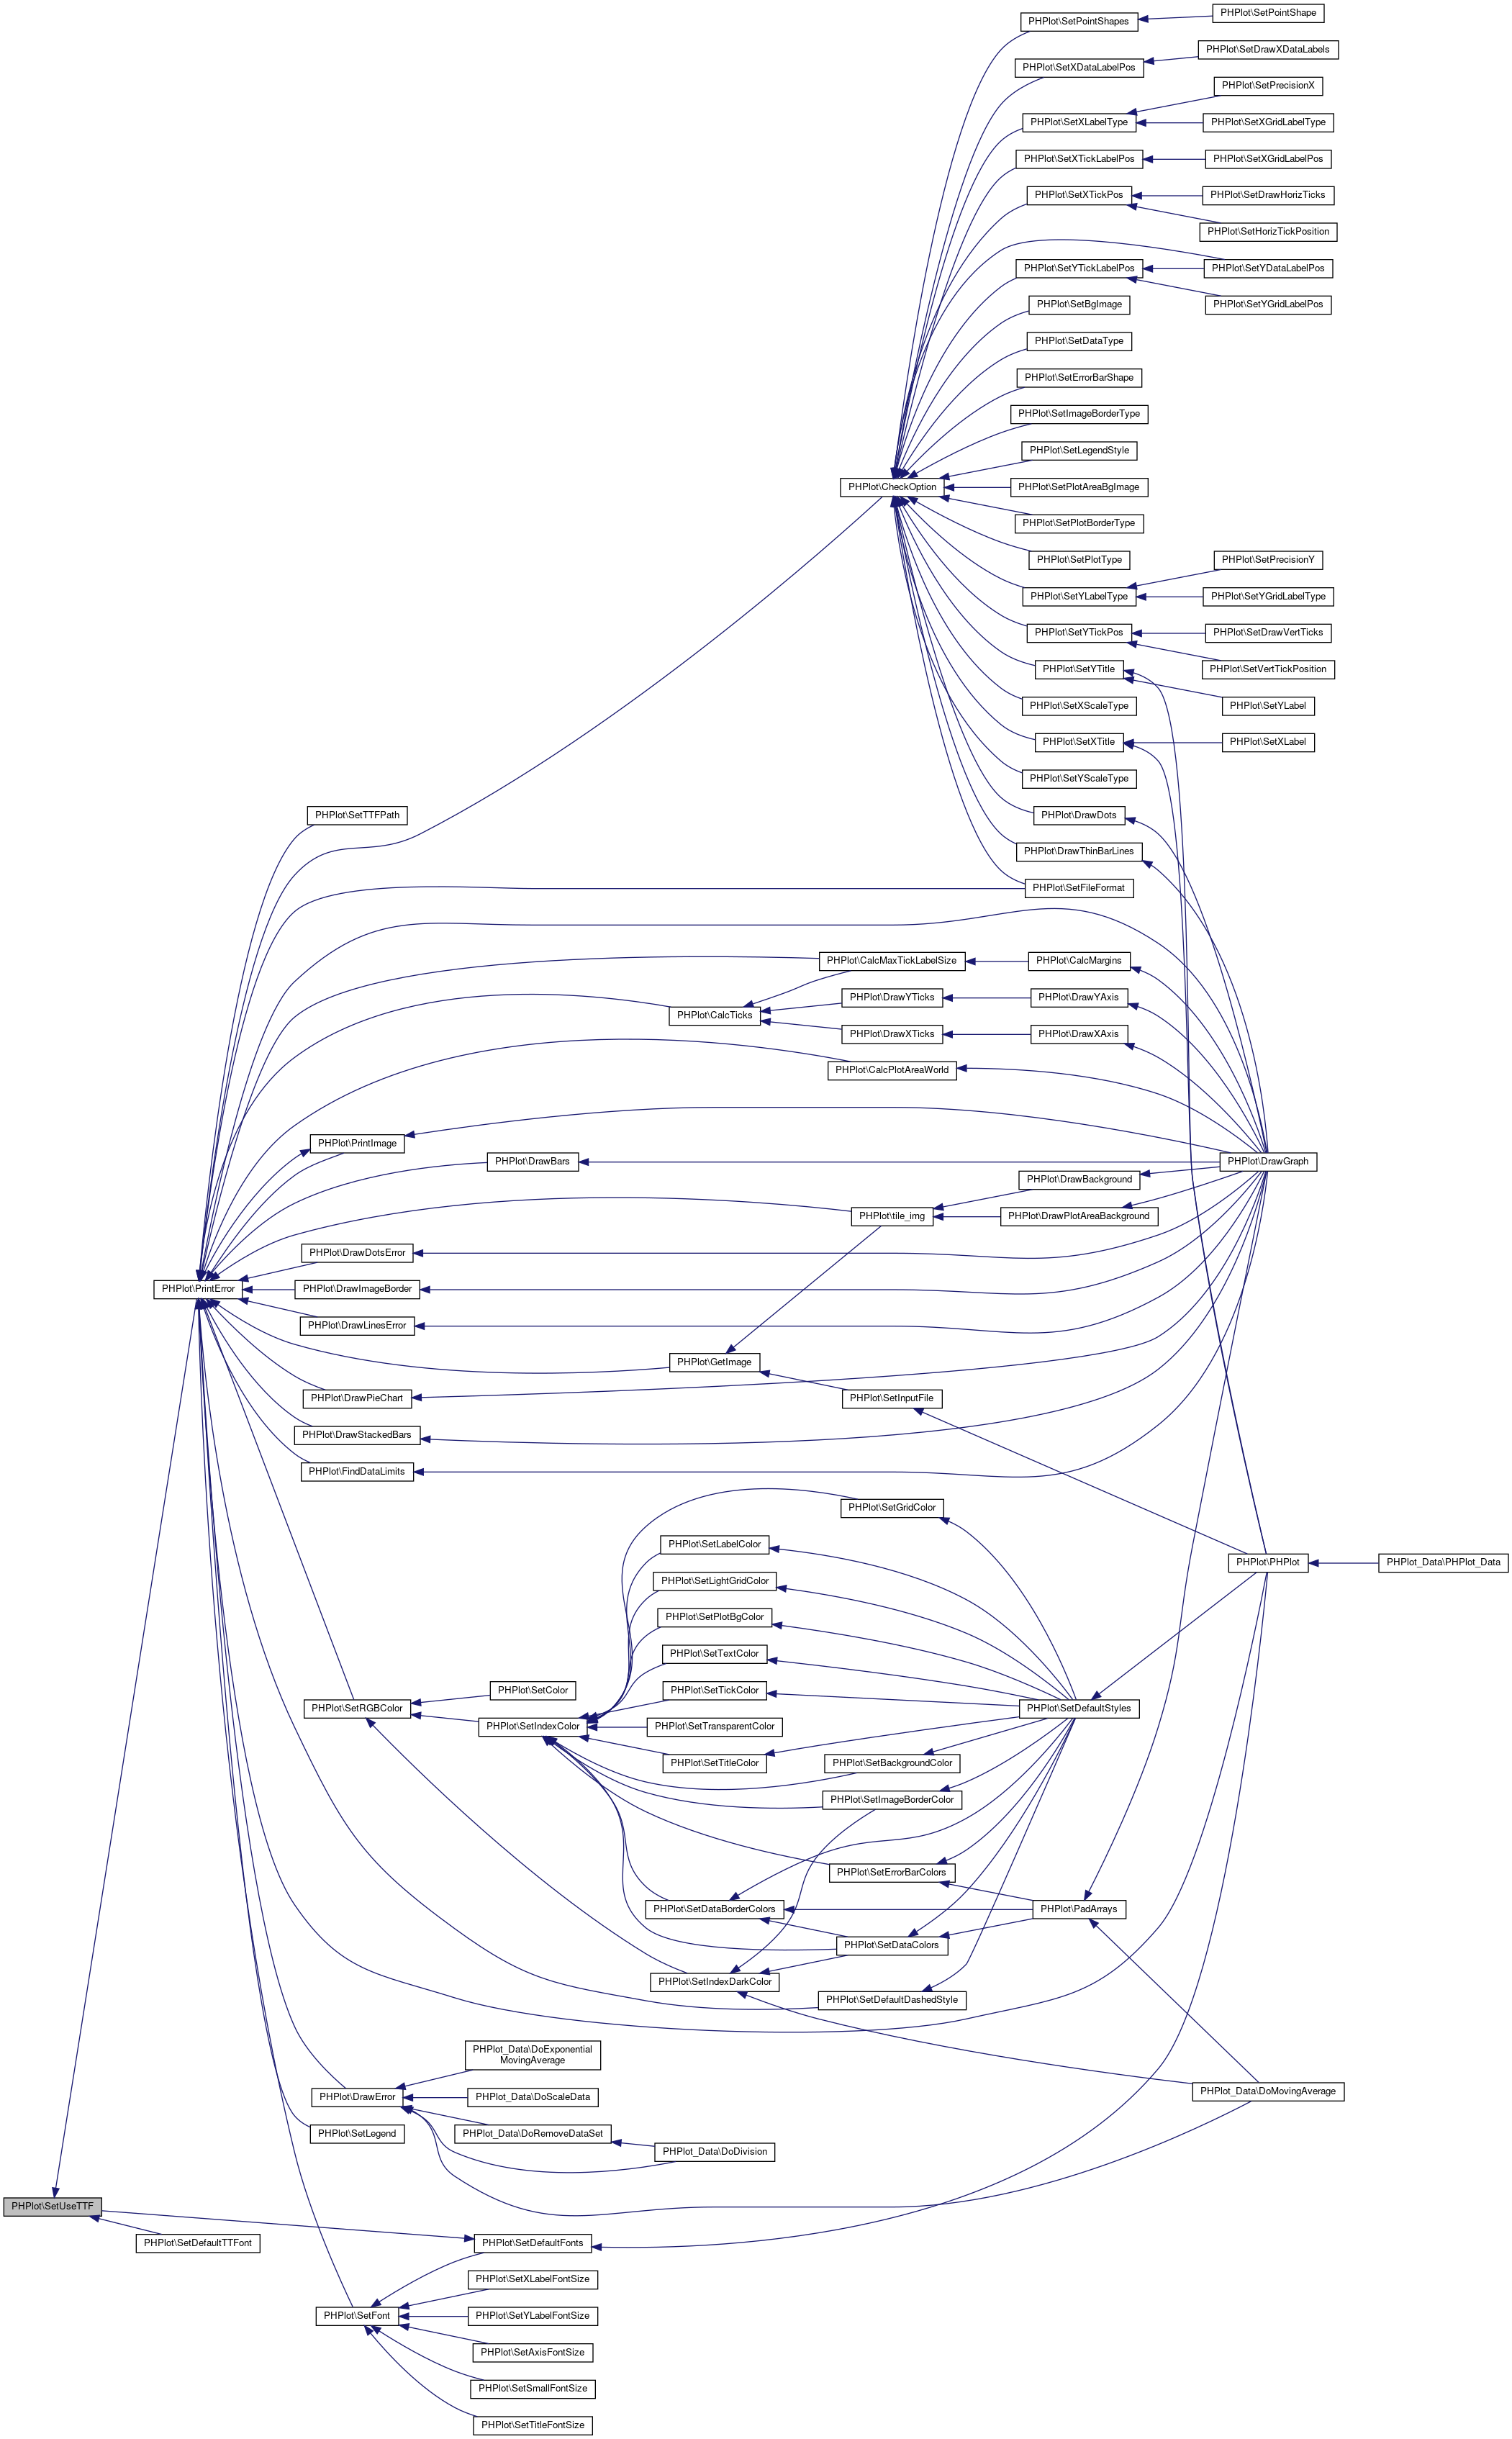
◆ SetVertTickIncrement()
| PHPlot::SetVertTickIncrement | ( | $inc | ) |
Definition at line 4836 of file phplot.php.
References SetYTickIncrement().
Here is the call graph for this function:
◆ SetVertTickPosition()
| PHPlot::SetVertTickPosition | ( | $which_tp | ) |
Definition at line 4844 of file phplot.php.
References SetYTickPos().
Here is the call graph for this function:
◆ SetXAxisPosition()
| PHPlot::SetXAxisPosition | ( | $pos | ) |
Sets the position of X axis.
- Parameters
-
pos int Position in world coordinates.
Definition at line 1926 of file phplot.php.
◆ SetXDataLabelAngle()
| PHPlot::SetXDataLabelAngle | ( | $which_xdla | ) |
Definition at line 4976 of file phplot.php.
References SetXLabelAngle().
Here is the call graph for this function:
◆ SetXDataLabelPos()
| PHPlot::SetXDataLabelPos | ( | $which_xdlp | ) |
Sets position for X labels following data points.
Definition at line 1554 of file phplot.php.
References CheckOption().
Referenced by SetDrawXDataLabels().
Here is the call graph for this function: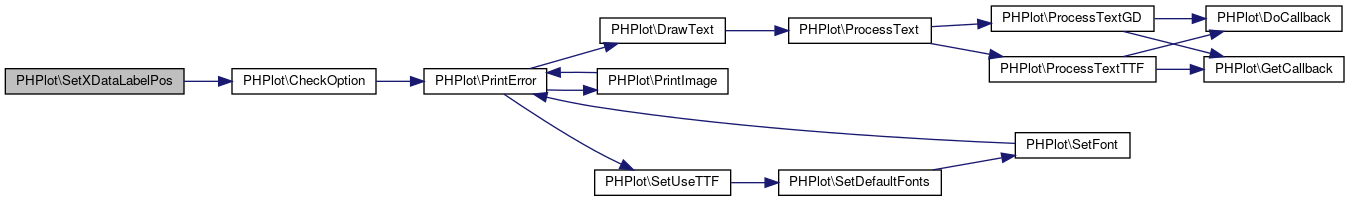 Here is the caller graph for this function:
◆ SetXGridLabelPos()
| PHPlot::SetXGridLabelPos | ( | $which_xglp | ) |
Definition at line 4949 of file phplot.php.
References SetXTickLabelPos().
Here is the call graph for this function:
◆ SetXGridLabelType()
| PHPlot::SetXGridLabelType | ( | $which_xglt | ) |
Definition at line 4935 of file phplot.php.
References SetXLabelType().
Here is the call graph for this function:
◆ SetXLabel()
| PHPlot::SetXLabel | ( | $which_xlab | ) |
Definition at line 4901 of file phplot.php.
References SetXTitle().
Here is the call graph for this function: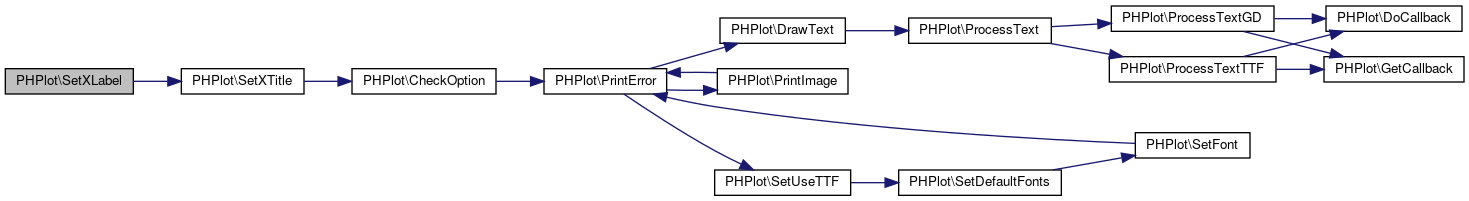
◆ SetXLabelAngle()
| PHPlot::SetXLabelAngle | ( | $which_xla | ) |
Definition at line 1658 of file phplot.php.
Referenced by SetXDataLabelAngle().
Here is the caller graph for this function:
◆ SetXLabelFontSize()
| PHPlot::SetXLabelFontSize | ( | $which_size | ) |
Definition at line 4885 of file phplot.php.
References SetFont().
Here is the call graph for this function: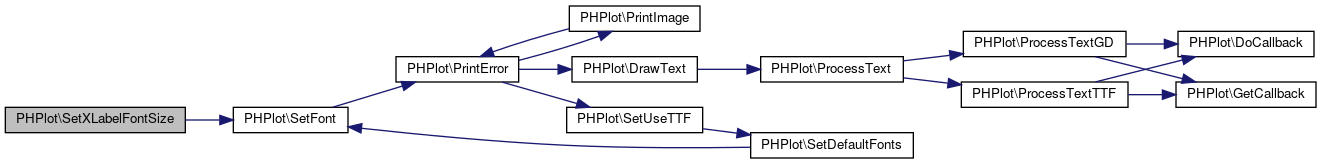
◆ SetXLabelType()
| PHPlot::SetXLabelType | ( | $which_xlt | ) |
Sets type for tick and data labels on X axis.
- Note
- 'title' type left for backwards compatibility.
Definition at line 1623 of file phplot.php.
References $x_label_type, and CheckOption().
Referenced by SetPrecisionX(), and SetXGridLabelType().
Here is the call graph for this function: Here is the caller graph for this function:
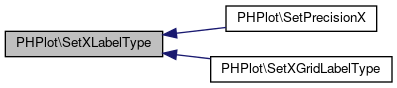
◆ SetXScaleType()
| PHPlot::SetXScaleType | ( | $which_xst | ) |
Definition at line 1933 of file phplot.php.
References $xscale_type, and CheckOption().
Here is the call graph for this function: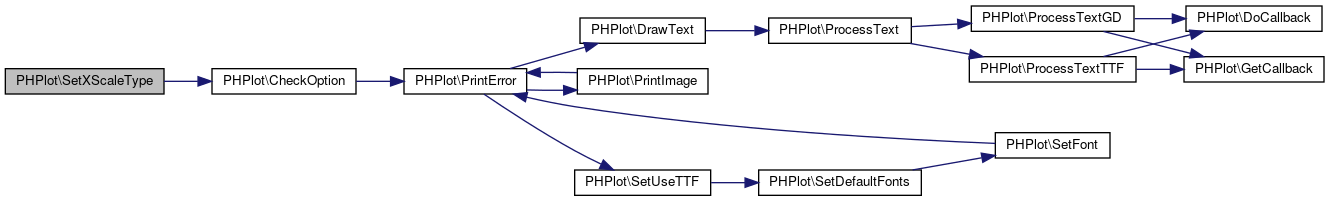
◆ SetXTickCrossing()
| PHPlot::SetXTickCrossing | ( | $which_xc | ) |
Definition at line 3221 of file phplot.php.
◆ SetXTickIncrement()
| PHPlot::SetXTickIncrement | ( | $which_ti = '' | ) |
Use either this or SetNumXTicks() to set where to place x tick marks
Definition at line 3116 of file phplot.php.
Referenced by SetHorizTickIncrement().
Here is the caller graph for this function:
◆ SetXTickLabelPos()
| PHPlot::SetXTickLabelPos | ( | $which_xtlp | ) |
Sets position for X labels following ticks (hence grid lines)
Definition at line 1597 of file phplot.php.
References CheckOption().
Referenced by SetXGridLabelPos().
Here is the call graph for this function: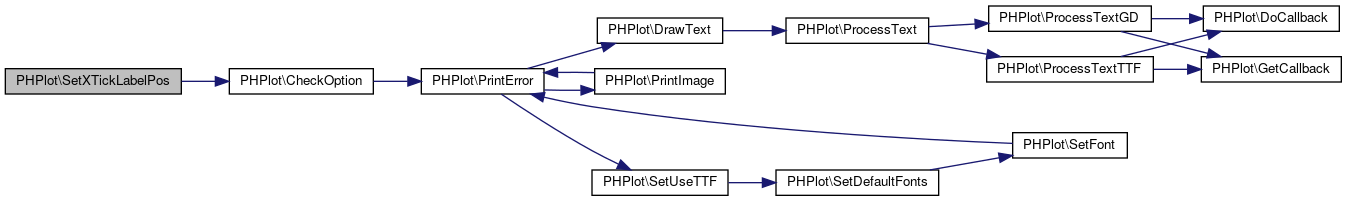 Here is the caller graph for this function:
◆ SetXTickLength()
| PHPlot::SetXTickLength | ( | $which_xln | ) |
Definition at line 3209 of file phplot.php.
Referenced by SetTickLength().
Here is the caller graph for this function:
◆ SetXTickPos()
| PHPlot::SetXTickPos | ( | $which_tp | ) |
Definition at line 3167 of file phplot.php.
References $x_tick_pos, and CheckOption().
Referenced by SetDrawHorizTicks(), and SetHorizTickPosition().
Here is the call graph for this function: Here is the caller graph for this function:
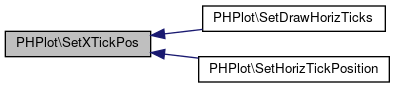
◆ SetXTimeFormat()
| PHPlot::SetXTimeFormat | ( | $which_xtf | ) |
Definition at line 1638 of file phplot.php.
◆ SetXTitle()
| PHPlot::SetXTitle | ( | $which_xtitle, | |
$which_xpos = 'plotdown' |
|||
| ) |
Sets the X axis title and position.
Definition at line 1868 of file phplot.php.
References CheckOption().
Referenced by PHPlot(), and SetXLabel().
Here is the call graph for this function: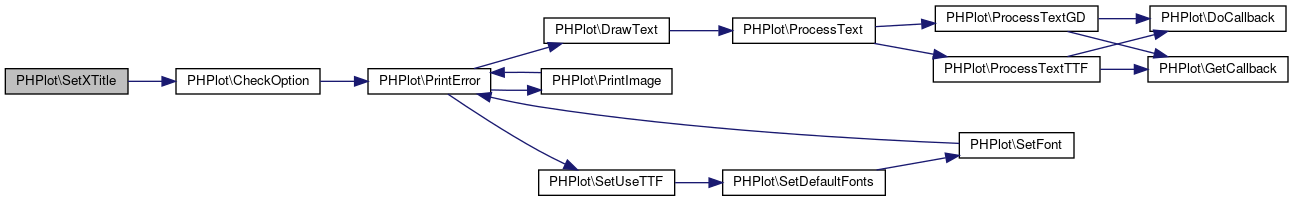 Here is the caller graph for this function:
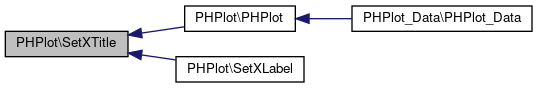
◆ SetXTitlePos()
| PHPlot::SetXTitlePos | ( | $xpos | ) |
- Deprecated:
- Use SetXtitle()
Definition at line 4958 of file phplot.php.
◆ SetYAxisPosition()
| PHPlot::SetYAxisPosition | ( | $pos | ) |
Sets the position of Y axis.
- Parameters
-
pos int Position in world coordinates.
Definition at line 1916 of file phplot.php.
◆ SetYDataLabelPos()
| PHPlot::SetYDataLabelPos | ( | $which_ydlp, | |
$which_distance_from_point = 0 |
|||
| ) |
Sets position for Y labels near data points. For past compatability we accept plotleft, ...but pass it to SetTickLabelPos eventually to specify how far up/down or left/right of the data point
Definition at line 1571 of file phplot.php.
References CheckOption(), and SetYTickLabelPos().
Here is the call graph for this function: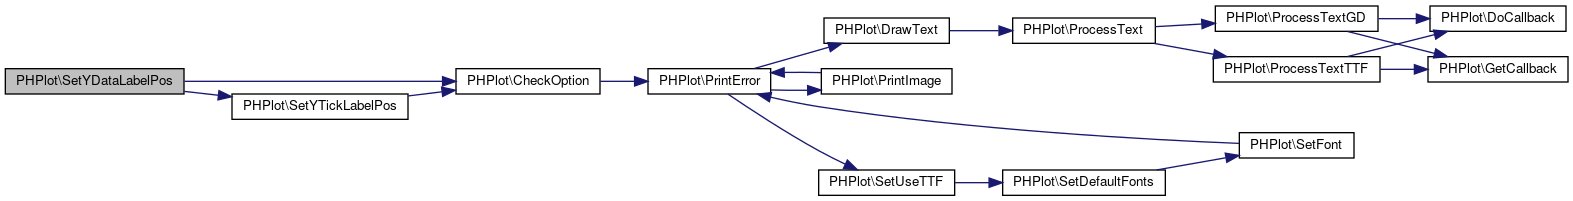
◆ SetYGridLabelPos()
| PHPlot::SetYGridLabelPos | ( | $which_yglp | ) |
Definition at line 4942 of file phplot.php.
References SetYTickLabelPos().
Here is the call graph for this function:
◆ SetYGridLabelType()
| PHPlot::SetYGridLabelType | ( | $which_yglt | ) |
Definition at line 4927 of file phplot.php.
References SetYLabelType().
Here is the call graph for this function: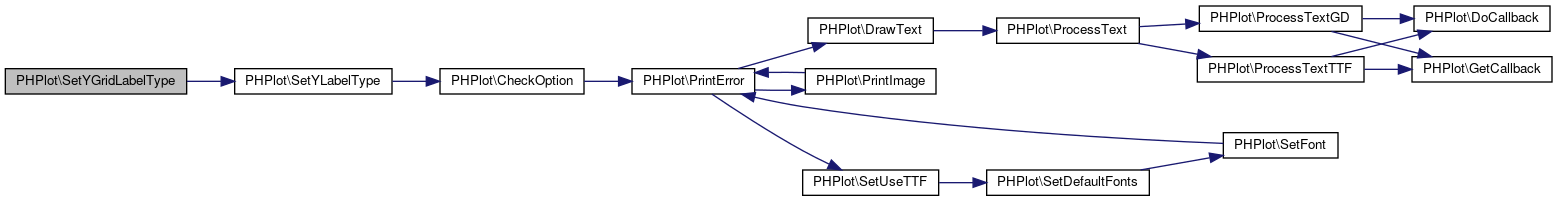
◆ SetYLabel()
| PHPlot::SetYLabel | ( | $which_ylab | ) |
Definition at line 4909 of file phplot.php.
References SetYTitle().
Here is the call graph for this function:
◆ SetYLabelAngle()
| PHPlot::SetYLabelAngle | ( | $which_yla | ) |
Definition at line 1664 of file phplot.php.
◆ SetYLabelFontSize()
| PHPlot::SetYLabelFontSize | ( | $which_size | ) |
Definition at line 4893 of file phplot.php.
References SetFont().
Here is the call graph for this function:
◆ SetYLabelType()
| PHPlot::SetYLabelType | ( | $which_ylt | ) |
Sets type for tick and data labels on Y axis.
Definition at line 1632 of file phplot.php.
References $y_label_type, and CheckOption().
Referenced by SetPrecisionY(), and SetYGridLabelType().
Here is the call graph for this function: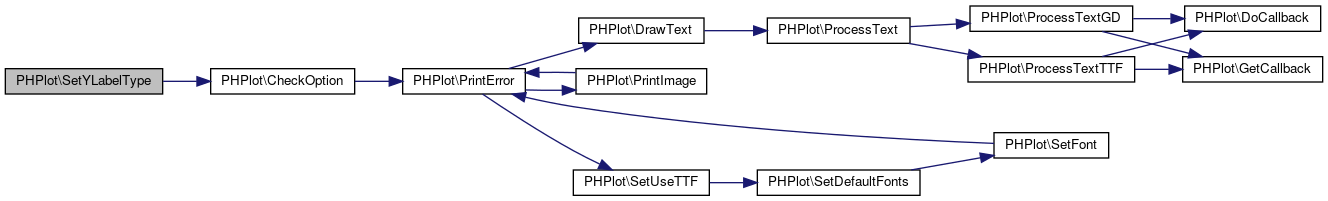 Here is the caller graph for this function:
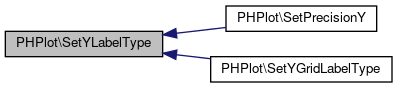
◆ SetYScaleType()
| PHPlot::SetYScaleType | ( | $which_yst | ) |
Definition at line 1939 of file phplot.php.
References $yscale_type, and CheckOption().
Here is the call graph for this function:
◆ SetYTickCrossing()
| PHPlot::SetYTickCrossing | ( | $which_yc | ) |
Definition at line 3227 of file phplot.php.
◆ SetYTickIncrement()
| PHPlot::SetYTickIncrement | ( | $which_ti = '' | ) |
Use either this or SetNumYTicks() to set where to place y tick marks
Definition at line 3128 of file phplot.php.
Referenced by PHPlot_Data\DoScaleData(), and SetVertTickIncrement().
Here is the caller graph for this function:
◆ SetYTickLabelPos()
| PHPlot::SetYTickLabelPos | ( | $which_ytlp | ) |
Sets position for Y labels following ticks (hence grid lines)
Definition at line 1612 of file phplot.php.
References $y_tick_label_pos, and CheckOption().
Referenced by SetYDataLabelPos(), and SetYGridLabelPos().
Here is the call graph for this function: Here is the caller graph for this function:
◆ SetYTickLength()
| PHPlot::SetYTickLength | ( | $which_yln | ) |
Definition at line 3215 of file phplot.php.
Referenced by SetTickLength().
Here is the caller graph for this function:
◆ SetYTickPos()
| PHPlot::SetYTickPos | ( | $which_tp | ) |
Definition at line 3159 of file phplot.php.
References $y_tick_pos, and CheckOption().
Referenced by SetDrawVertTicks(), and SetVertTickPosition().
Here is the call graph for this function: Here is the caller graph for this function:
◆ SetYTimeFormat()
| PHPlot::SetYTimeFormat | ( | $which_ytf | ) |
Definition at line 1644 of file phplot.php.
◆ SetYTitle()
| PHPlot::SetYTitle | ( | $which_ytitle, | |
$which_ypos = 'plotleft' |
|||
| ) |
Sets the Y axis title and position.
Definition at line 1883 of file phplot.php.
References CheckOption().
Referenced by PHPlot(), and SetYLabel().
Here is the call graph for this function: Here is the caller graph for this function:
◆ SetYTitlePos()
| PHPlot::SetYTitlePos | ( | $xpos | ) |
Definition at line 4967 of file phplot.php.
◆ SizeText()
| PHPlot::SizeText | ( | $which_font, | |
| $which_angle, | |||
| $which_text | |||
| ) |
Definition at line 1333 of file phplot.php.
References ProcessText().
Referenced by CalcMargins(), CalcMaxDataLabelSize(), CalcMaxTickLabelSize(), and DrawLegend().
Here is the call graph for this function: Here is the caller graph for this function:
◆ tile_img()
| PHPlot::tile_img | ( | $file, | |
| $xorig, | |||
| $yorig, | |||
| $width, | |||
| $height, | |||
| $mode | |||
| ) |
Tiles an image at some given coordinates.
- Parameters
-
$file string Filename of the picture to be used as tile. $xorig int X coordinate of the plot where the tile is to begin. $yorig int Y coordinate of the plot where the tile is to begin. $width int Width of the area to be tiled. $height int Height of the area to be tiled. $mode string One of 'centeredtile', 'tile', 'scale'.
Definition at line 3287 of file phplot.php.
References $file, GetImage(), and PrintError().
Referenced by DrawBackground(), and DrawPlotAreaBackground().
Here is the call graph for this function: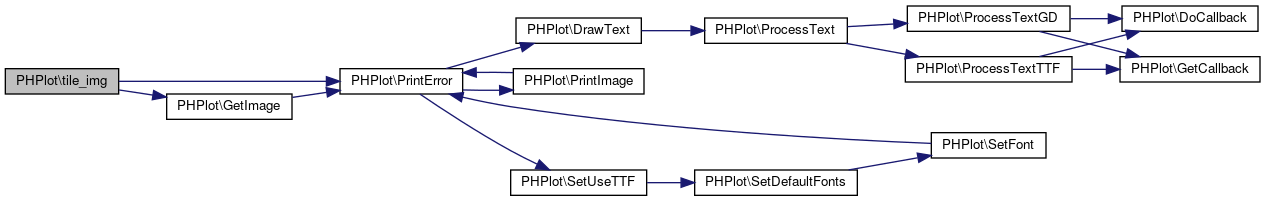 Here is the caller graph for this function:
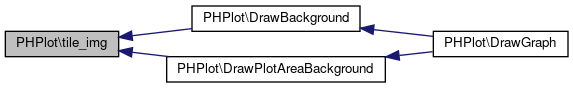
◆ xtr()
| PHPlot::xtr | ( | $x_world | ) |
Translate X world coordinate into pixel coordinate See CalcTranslation() for calculation of xscale.
Definition at line 2919 of file phplot.php.
Referenced by CalcTranslation(), DrawArea(), DrawBars(), DrawDataLabel(), DrawDot(), DrawDots(), DrawDotsError(), DrawLegend(), DrawLines(), DrawLinesError(), DrawSquared(), DrawStackedBars(), DrawThinBarLines(), DrawXTicks(), and DrawYErrorBar().
Here is the caller graph for this function: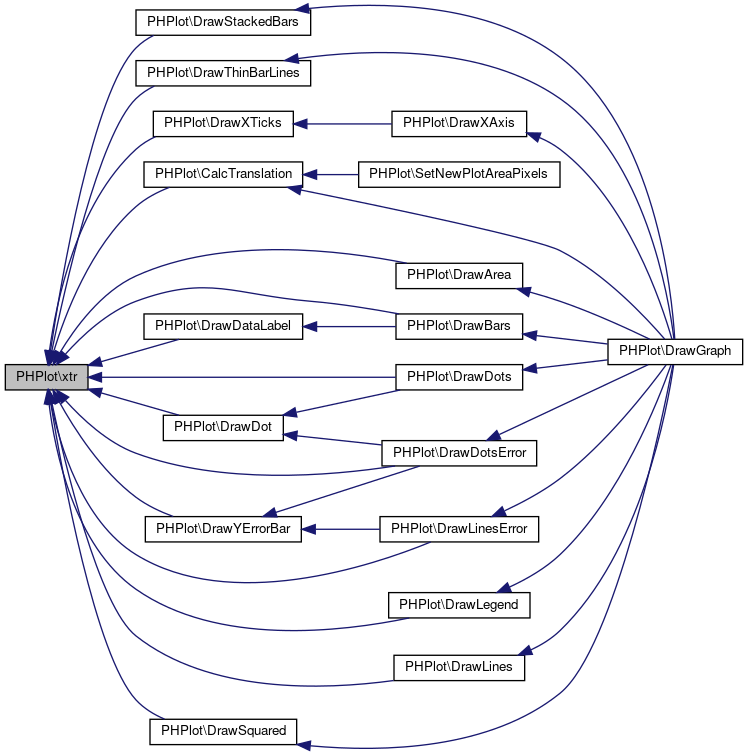
◆ ytr()
| PHPlot::ytr | ( | $y_world | ) |
Translate Y world coordinate into pixel coordinate. See CalcTranslation() for calculation of yscale.
Definition at line 2934 of file phplot.php.
Referenced by CalcTranslation(), DrawArea(), DrawBars(), DrawDataLabel(), DrawDot(), DrawLegend(), DrawLines(), DrawLinesError(), DrawPlotBorder(), DrawSquared(), DrawStackedBars(), DrawThinBarLines(), DrawXDataLine(), DrawYErrorBar(), and DrawYTicks().
Here is the caller graph for this function: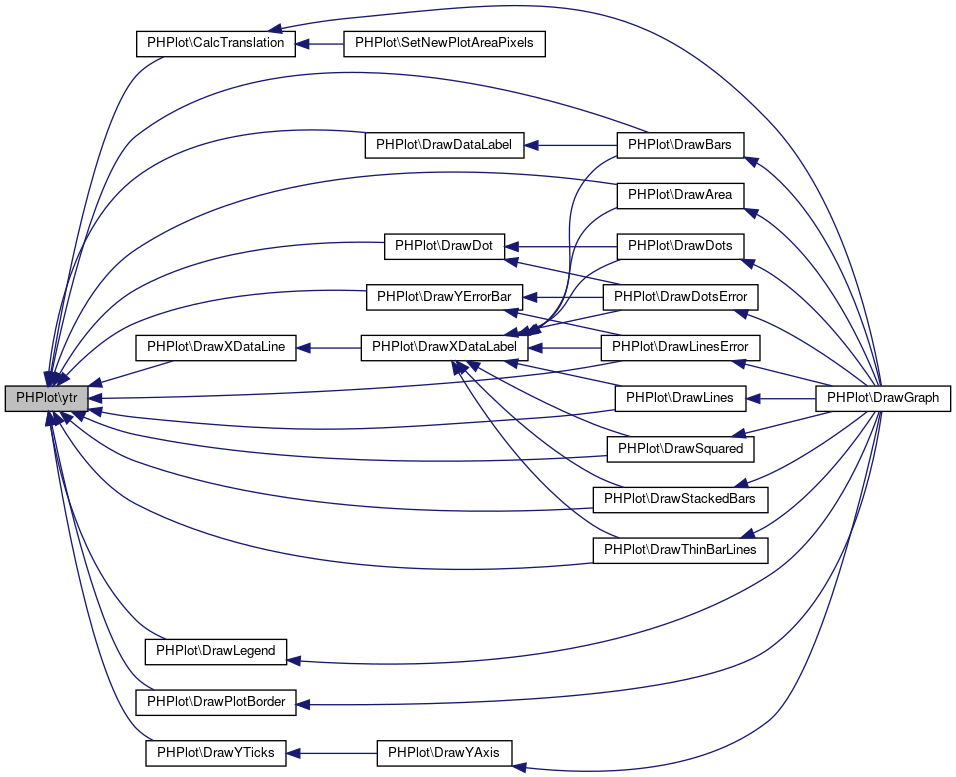
Field Documentation
◆ $bar_extra_space
| PHPlot::$bar_extra_space = 0.5 |
Definition at line 65 of file phplot.php.
Referenced by CalcBarWidths().
◆ $bar_width_adjust
| PHPlot::$bar_width_adjust = 1 |
Definition at line 66 of file phplot.php.
Referenced by CalcBarWidths().
◆ $bg_color
| PHPlot::$bg_color = 'white' |
Definition at line 155 of file phplot.php.
◆ $browser_cache
| PHPlot::$browser_cache = FALSE |
Definition at line 34 of file phplot.php.
◆ $callbacks
| PHPlot::$callbacks |
Definition at line 186 of file phplot.php.
◆ $color_array
| PHPlot::$color_array = 'small' |
Definition at line 151 of file phplot.php.
◆ $dashed_grid
| PHPlot::$dashed_grid = TRUE |
Definition at line 147 of file phplot.php.
◆ $dashed_style
| PHPlot::$dashed_style = '2-4' |
Definition at line 168 of file phplot.php.
◆ $data_border_colors
| PHPlot::$data_border_colors = array('black') |
Definition at line 164 of file phplot.php.
◆ $data_colors
| PHPlot::$data_colors = array('SkyBlue', 'green', 'orange', 'blue', 'orange', 'red', 'violet', 'azure1') |
Definition at line 162 of file phplot.php.
◆ $data_type
| PHPlot::$data_type = 'text-data' |
Definition at line 60 of file phplot.php.
Referenced by SetDataType().
◆ $data_units_text
| PHPlot::$data_units_text = '' |
Definition at line 71 of file phplot.php.
◆ $default_ttfont
| PHPlot::$default_ttfont = 'benjamingothic.ttf' |
Definition at line 48 of file phplot.php.
Referenced by SetFont().
◆ $draw_broken_lines
| PHPlot::$draw_broken_lines = FALSE |
Definition at line 183 of file phplot.php.
◆ $draw_plot_area_background
| PHPlot::$draw_plot_area_background = FALSE |
Definition at line 182 of file phplot.php.
◆ $draw_x_data_label_lines
| PHPlot::$draw_x_data_label_lines = FALSE |
Definition at line 99 of file phplot.php.
◆ $draw_x_grid
| PHPlot::$draw_x_grid = FALSE |
Definition at line 144 of file phplot.php.
◆ $draw_y_data_label_lines
| PHPlot::$draw_y_data_label_lines = FALSE |
Definition at line 100 of file phplot.php.
◆ $draw_y_grid
| PHPlot::$draw_y_grid = TRUE |
Definition at line 145 of file phplot.php.
◆ $error_bar_colors
| PHPlot::$error_bar_colors = array('SkyBlue', 'green', 'orange', 'blue', 'orange', 'red', 'violet', 'azure1') |
Definition at line 163 of file phplot.php.
◆ $error_bar_line_width
| PHPlot::$error_bar_line_width = 1 |
Definition at line 175 of file phplot.php.
◆ $error_bar_shape
| PHPlot::$error_bar_shape = 'tee' |
Definition at line 174 of file phplot.php.
Referenced by SetErrorBarShape().
◆ $error_bar_size
| PHPlot::$error_bar_size = 5 |
Definition at line 173 of file phplot.php.
◆ $file_format
| PHPlot::$file_format = 'png' |
Definition at line 56 of file phplot.php.
◆ $grid_at_foreground
| PHPlot::$grid_at_foreground = FALSE |
Definition at line 148 of file phplot.php.
◆ $grid_color
| PHPlot::$grid_color = 'black' |
Definition at line 158 of file phplot.php.
◆ $group_frac_width
| PHPlot::$group_frac_width = 0.7 |
Definition at line 64 of file phplot.php.
◆ $i_border
| PHPlot::$i_border = array(194, 194, 194) |
Definition at line 153 of file phplot.php.
◆ $image_border_type
| PHPlot::$image_border_type = 'none' |
Definition at line 178 of file phplot.php.
Referenced by SetImageBorderType().
◆ $is_inline
| PHPlot::$is_inline = FALSE |
Definition at line 33 of file phplot.php.
◆ $label_color
| PHPlot::$label_color = 'black' |
Definition at line 156 of file phplot.php.
◆ $label_scale_position
| PHPlot::$label_scale_position = 0.5 |
Definition at line 63 of file phplot.php.
◆ $legend
| PHPlot::$legend = '' |
Definition at line 114 of file phplot.php.
Referenced by DrawPieChart().
◆ $light_grid_color
| PHPlot::$light_grid_color = 'gray' |
Definition at line 159 of file phplot.php.
◆ $line_spacing
| PHPlot::$line_spacing = 4 |
Definition at line 49 of file phplot.php.
Referenced by DrawLegend(), and ProcessTextGD().
◆ $line_styles
| PHPlot::$line_styles = array('solid', 'solid', 'dashed') |
Definition at line 167 of file phplot.php.
◆ $line_widths
| PHPlot::$line_widths = 1 |
Definition at line 166 of file phplot.php.
Referenced by ProcessTextTTF().
◆ $num_x_ticks
| PHPlot::$num_x_ticks = '' |
Definition at line 132 of file phplot.php.
Referenced by CalcTicks().
◆ $num_y_ticks
| PHPlot::$num_y_ticks = '' |
Definition at line 133 of file phplot.php.
Referenced by CalcTicks().
◆ $output_file
| PHPlot::$output_file = '' |
Definition at line 57 of file phplot.php.
◆ $plot_bg_color
| PHPlot::$plot_bg_color = 'white' |
Definition at line 154 of file phplot.php.
◆ $plot_border_type
| PHPlot::$plot_border_type = 'sides' |
Definition at line 177 of file phplot.php.
Referenced by SetPlotBorderType().
◆ $plot_type
| PHPlot::$plot_type = 'linepoints' |
Definition at line 61 of file phplot.php.
Referenced by SetPlotType().
◆ $point_shapes
| PHPlot::$point_shapes = array('diamond') |
Definition at line 171 of file phplot.php.
◆ $point_sizes
| PHPlot::$point_sizes = array(5,5,3) |
Definition at line 170 of file phplot.php.
◆ $safe_margin
| PHPlot::$safe_margin = 5 |
Definition at line 37 of file phplot.php.
Referenced by CalcMargins(), DrawLegend(), and DrawTitle().
◆ $shading
| PHPlot::$shading = 5 |
Definition at line 180 of file phplot.php.
Referenced by DrawBars().
◆ $skip_bottom_tick
| PHPlot::$skip_bottom_tick = FALSE |
Definition at line 139 of file phplot.php.
Referenced by CalcTicks().
◆ $skip_left_tick
| PHPlot::$skip_left_tick = FALSE |
Definition at line 140 of file phplot.php.
Referenced by CalcTicks().
◆ $skip_right_tick
| PHPlot::$skip_right_tick = FALSE |
Definition at line 141 of file phplot.php.
Referenced by CalcTicks().
◆ $skip_top_tick
| PHPlot::$skip_top_tick = FALSE |
Definition at line 138 of file phplot.php.
Referenced by CalcTicks().
◆ $text_color
| PHPlot::$text_color = 'black' |
Definition at line 157 of file phplot.php.
◆ $tick_color
| PHPlot::$tick_color = 'black' |
Definition at line 160 of file phplot.php.
◆ $title_color
| PHPlot::$title_color = 'black' |
Definition at line 161 of file phplot.php.
◆ $title_txt
| PHPlot::$title_txt = '' |
Definition at line 74 of file phplot.php.
◆ $ttf_path
| PHPlot::$ttf_path = '.' |
Definition at line 47 of file phplot.php.
◆ $use_ttf
| PHPlot::$use_ttf = FALSE |
Definition at line 46 of file phplot.php.
◆ $x_axis_position
| PHPlot::$x_axis_position = '' |
Definition at line 39 of file phplot.php.
◆ $x_data_label_pos
| PHPlot::$x_data_label_pos = 'plotdown' |
Definition at line 96 of file phplot.php.
Referenced by CalcMargins().
◆ $x_label_angle
| PHPlot::$x_label_angle = 0 |
Definition at line 52 of file phplot.php.
Referenced by CalcMaxDataLabelSize(), CalcMaxTickLabelSize(), and DrawDataLabel().
◆ $x_label_type
| PHPlot::$x_label_type = '' |
Definition at line 103 of file phplot.php.
Referenced by SetXLabelType().
◆ $x_precision
| PHPlot::$x_precision = 1 |
Definition at line 69 of file phplot.php.
◆ $x_tick_cross
| PHPlot::$x_tick_cross = 3 |
Definition at line 126 of file phplot.php.
◆ $x_tick_inc
| PHPlot::$x_tick_inc = '' |
Definition at line 135 of file phplot.php.
Referenced by CalcTicks().
◆ $x_tick_label_pos
| PHPlot::$x_tick_label_pos = 'plotdown' |
Definition at line 92 of file phplot.php.
Referenced by CalcMargins().
◆ $x_tick_length
| PHPlot::$x_tick_length = 5 |
Definition at line 123 of file phplot.php.
Referenced by CalcMargins().
◆ $x_tick_pos
| PHPlot::$x_tick_pos = 'plotdown' |
Definition at line 129 of file phplot.php.
Referenced by CalcMargins(), and SetXTickPos().
◆ $x_time_format
| PHPlot::$x_time_format = '%H:%M:%S' |
Definition at line 105 of file phplot.php.
◆ $x_title_pos
| PHPlot::$x_title_pos = 'plotdown' |
Definition at line 77 of file phplot.php.
Referenced by CalcMargins().
◆ $x_title_txt
| PHPlot::$x_title_txt = '' |
Definition at line 76 of file phplot.php.
◆ $xscale_type
| PHPlot::$xscale_type = 'linear' |
Definition at line 42 of file phplot.php.
Referenced by SetXScaleType().
◆ $y_axis_position
| PHPlot::$y_axis_position = '' |
Definition at line 40 of file phplot.php.
◆ $y_data_label_pos
| PHPlot::$y_data_label_pos = 'plotleft' |
Definition at line 97 of file phplot.php.
◆ $y_label_angle
| PHPlot::$y_label_angle = 0 |
Definition at line 53 of file phplot.php.
Referenced by CalcMaxTickLabelSize().
◆ $y_label_type
| PHPlot::$y_label_type = '' |
Definition at line 104 of file phplot.php.
Referenced by SetYLabelType().
◆ $y_precision
| PHPlot::$y_precision = 1 |
Definition at line 68 of file phplot.php.
◆ $y_tick_cross
| PHPlot::$y_tick_cross = 3 |
Definition at line 127 of file phplot.php.
◆ $y_tick_inc
| PHPlot::$y_tick_inc = '' |
Definition at line 136 of file phplot.php.
Referenced by CalcTicks().
◆ $y_tick_label_pos
| PHPlot::$y_tick_label_pos = 'plotleft' |
Definition at line 93 of file phplot.php.
Referenced by CalcMargins(), and SetYTickLabelPos().
◆ $y_tick_length
| PHPlot::$y_tick_length = 5 |
Definition at line 124 of file phplot.php.
Referenced by CalcMargins().
◆ $y_tick_pos
| PHPlot::$y_tick_pos = 'plotleft' |
Definition at line 130 of file phplot.php.
Referenced by CalcMargins(), and SetYTickPos().
◆ $y_time_format
| PHPlot::$y_time_format = '%H:%M:%S' |
Definition at line 106 of file phplot.php.
◆ $y_title_pos
| PHPlot::$y_title_pos = 'plotleft' |
Definition at line 80 of file phplot.php.
Referenced by CalcMargins().
◆ $y_title_txt
| PHPlot::$y_title_txt = '' |
Definition at line 79 of file phplot.php.
◆ $yscale_type
| PHPlot::$yscale_type = 'linear' |
Definition at line 43 of file phplot.php.
Referenced by SetYScaleType().
The documentation for this class was generated from the following file:
- Modules/SurveyQuestionPool/phplot/phplot.php
