 Collaboration diagram for PHPExcel_Chart_Renderer_jpgraph:
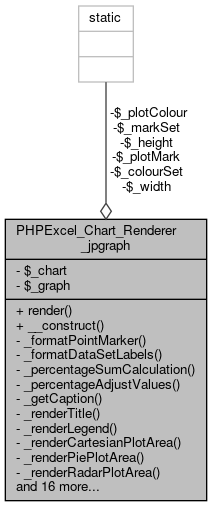
Public Member Functions | |
| render ($outputDestination) | |
| __construct (PHPExcel_Chart $chart) | |
| Create a new PHPExcel_Chart_Renderer_jpgraph. More... | |
Private Member Functions | |
| _formatPointMarker ($seriesPlot, $markerID) | |
| _formatDataSetLabels ($groupID, $datasetLabels, $labelCount, $rotation='') | |
| _percentageSumCalculation ($groupID, $seriesCount) | |
| _percentageAdjustValues ($dataValues, $sumValues) | |
| _getCaption ($captionElement) | |
| _renderTitle () | |
| _renderLegend () | |
| _renderCartesianPlotArea ($type='textlin') | |
| _renderPiePlotArea ($doughnut=False) | |
| _renderRadarPlotArea () | |
| _renderPlotLine ($groupID, $filled=false, $combination=false, $dimensions='2d') | |
| _renderPlotBar ($groupID, $dimensions='2d') | |
| _renderPlotScatter ($groupID, $bubble) | |
| _renderPlotRadar ($groupID) | |
| _renderPlotContour ($groupID) | |
| _renderPlotStock ($groupID) | |
| _renderAreaChart ($groupCount, $dimensions='2d') | |
| _renderLineChart ($groupCount, $dimensions='2d') | |
| _renderBarChart ($groupCount, $dimensions='2d') | |
| _renderScatterChart ($groupCount) | |
| _renderBubbleChart ($groupCount) | |
| _renderPieChart ($groupCount, $dimensions='2d', $doughnut=False, $multiplePlots=False) | |
| _renderRadarChart ($groupCount) | |
| _renderStockChart ($groupCount) | |
| _renderContourChart ($groupCount, $dimensions) | |
| _renderCombinationChart ($groupCount, $dimensions, $outputDestination) | |
Private Attributes | |
| $_chart = null | |
| $_graph = null | |
Static Private Attributes | |
| static | $_width = 640 |
| static | $_height = 480 |
| static | $_colourSet |
| static | $_markSet |
| static | $_plotColour = 0 |
| static | $_plotMark = 0 |
Detailed Description
Definition at line 40 of file jpgraph.php.
Constructor & Destructor Documentation
◆ __construct()
| PHPExcel_Chart_Renderer_jpgraph::__construct | ( | PHPExcel_Chart | $chart | ) |
Create a new PHPExcel_Chart_Renderer_jpgraph.
Definition at line 849 of file jpgraph.php.
References $chart.
Member Function Documentation
◆ _formatDataSetLabels()
|
private |
Definition at line 101 of file jpgraph.php.
References PHPExcel_Style_NumberFormat\toFormattedString().
Referenced by _renderPieChart(), _renderPlotBar(), _renderPlotLine(), and _renderPlotStock().
Here is the call graph for this function: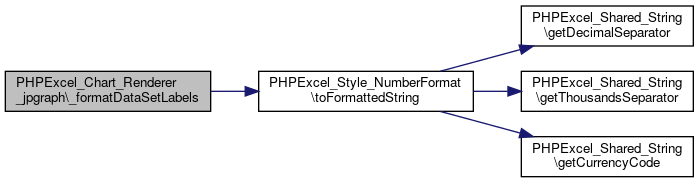 Here is the caller graph for this function:
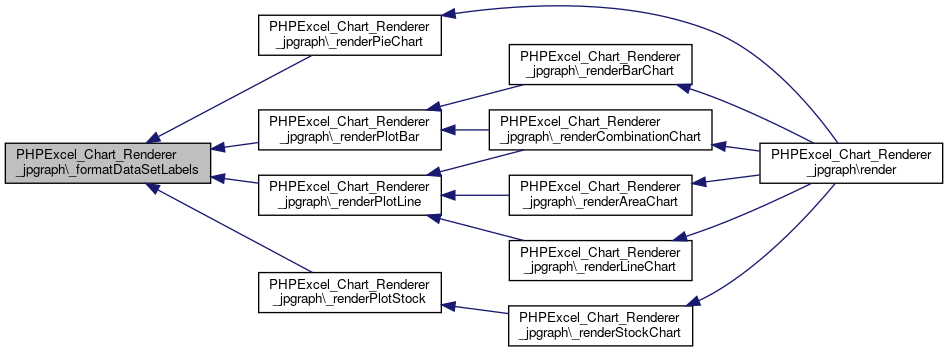
◆ _formatPointMarker()
|
private |
Definition at line 74 of file jpgraph.php.
Referenced by _renderPlotLine(), _renderPlotRadar(), and _renderPlotScatter().
Here is the caller graph for this function:
◆ _getCaption()
|
private |
Definition at line 160 of file jpgraph.php.
Referenced by _renderCartesianPlotArea(), and _renderTitle().
Here is the caller graph for this function: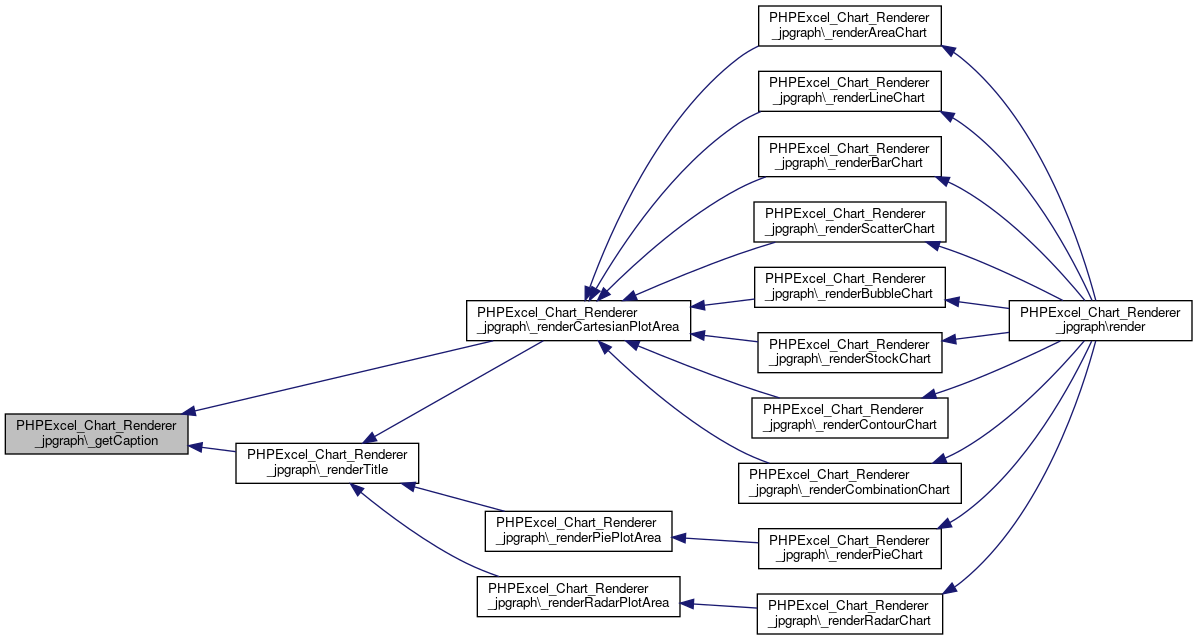
◆ _percentageAdjustValues()
|
private |
Definition at line 151 of file jpgraph.php.
Referenced by _renderPlotBar(), and _renderPlotLine().
Here is the caller graph for this function:
◆ _percentageSumCalculation()
|
private |
Definition at line 130 of file jpgraph.php.
Referenced by _renderPlotBar(), and _renderPlotLine().
Here is the caller graph for this function: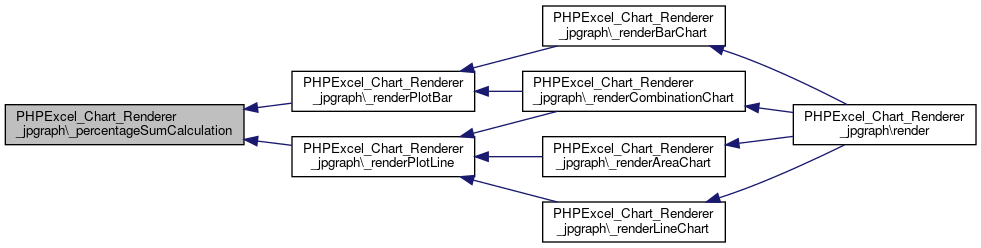
◆ _renderAreaChart()
|
private |
Definition at line 556 of file jpgraph.php.
References _renderCartesianPlotArea(), _renderPlotLine(), and PHPExcel_Settings\getChartRendererPath().
Referenced by render().
Here is the call graph for this function: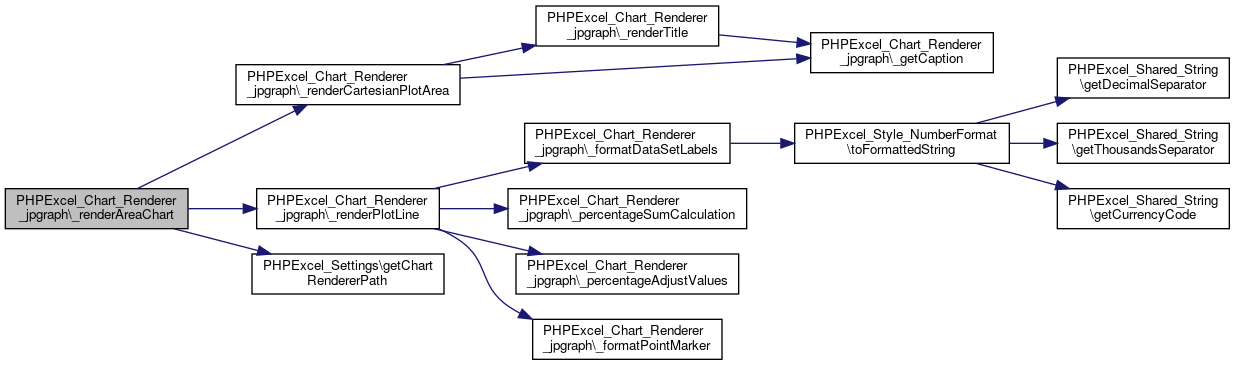 Here is the caller graph for this function:
◆ _renderBarChart()
|
private |
Definition at line 578 of file jpgraph.php.
References _renderCartesianPlotArea(), _renderPlotBar(), and PHPExcel_Settings\getChartRendererPath().
Referenced by render().
Here is the call graph for this function: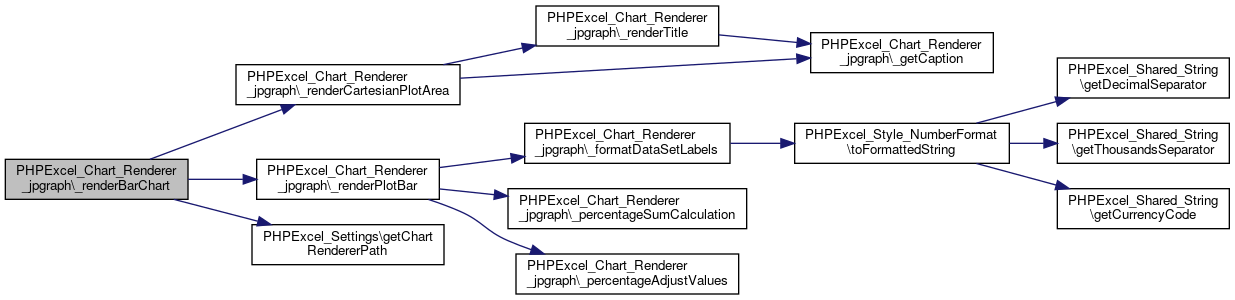 Here is the caller graph for this function:
◆ _renderBubbleChart()
|
private |
Definition at line 602 of file jpgraph.php.
References _renderCartesianPlotArea(), _renderPlotScatter(), and PHPExcel_Settings\getChartRendererPath().
Referenced by render().
Here is the call graph for this function: Here is the caller graph for this function:
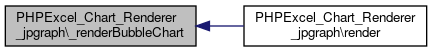
◆ _renderCartesianPlotArea()
|
private |
Definition at line 214 of file jpgraph.php.
References $title, $xAxisLabel, $yAxisLabel, _getCaption(), and _renderTitle().
Referenced by _renderAreaChart(), _renderBarChart(), _renderBubbleChart(), _renderCombinationChart(), _renderContourChart(), _renderLineChart(), _renderScatterChart(), and _renderStockChart().
Here is the call graph for this function: Here is the caller graph for this function:
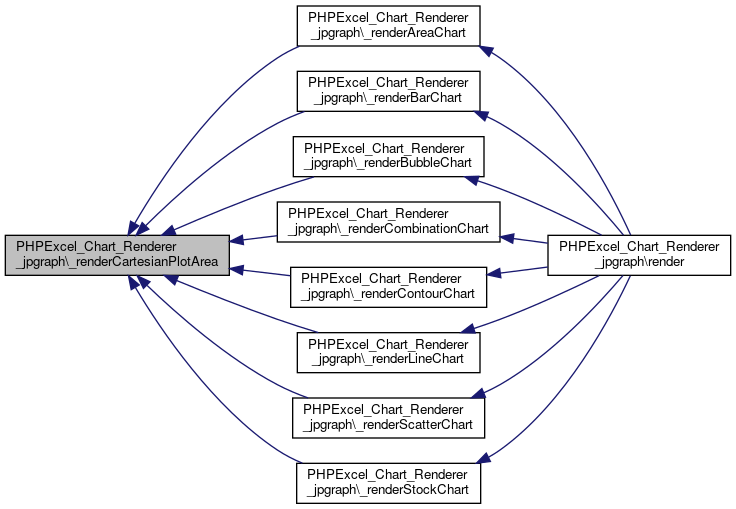
◆ _renderCombinationChart()
|
private |
Definition at line 721 of file jpgraph.php.
References _renderCartesianPlotArea(), _renderLegend(), _renderPlotBar(), _renderPlotLine(), _renderPlotScatter(), and PHPExcel_Settings\getChartRendererPath().
Referenced by render().
Here is the call graph for this function: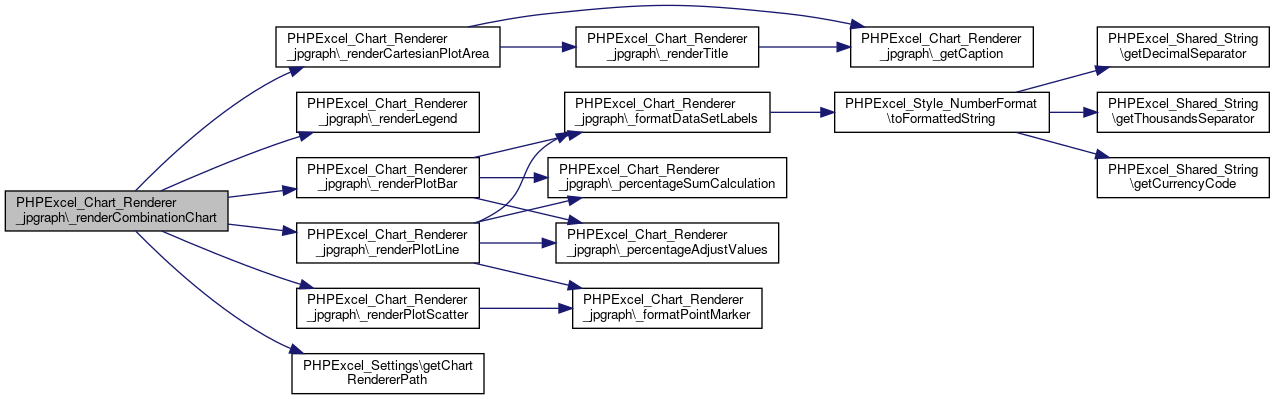 Here is the caller graph for this function:
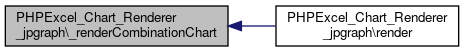
◆ _renderContourChart()
|
private |
Definition at line 710 of file jpgraph.php.
References _renderCartesianPlotArea(), _renderPlotContour(), and PHPExcel_Settings\getChartRendererPath().
Referenced by render().
Here is the call graph for this function: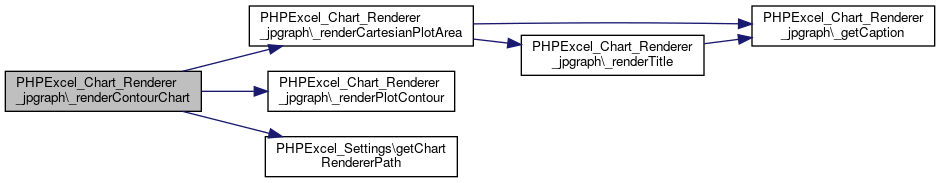 Here is the caller graph for this function:
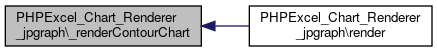
◆ _renderLegend()
|
private |
Definition at line 183 of file jpgraph.php.
References $legend.
Referenced by _renderCombinationChart(), and render().
Here is the caller graph for this function: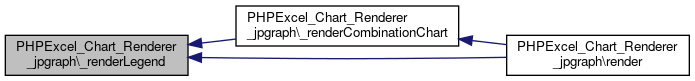
◆ _renderLineChart()
|
private |
Definition at line 567 of file jpgraph.php.
References _renderCartesianPlotArea(), _renderPlotLine(), and PHPExcel_Settings\getChartRendererPath().
Referenced by render().
Here is the call graph for this function: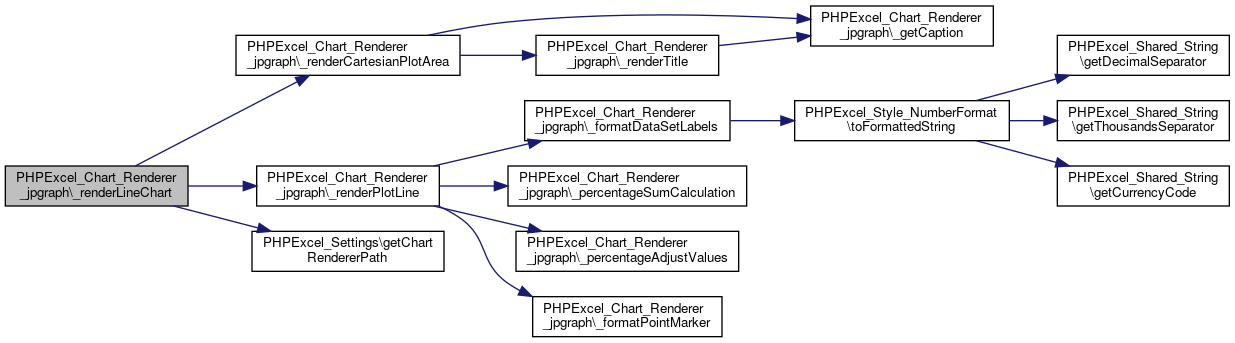 Here is the caller graph for this function:
◆ _renderPieChart()
|
private |
Definition at line 613 of file jpgraph.php.
References _formatDataSetLabels(), _renderPiePlotArea(), and PHPExcel_Settings\getChartRendererPath().
Referenced by render().
Here is the call graph for this function: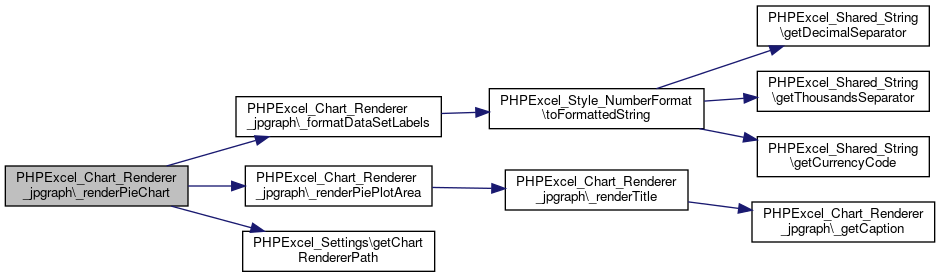 Here is the caller graph for this function:
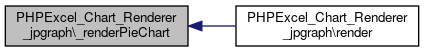
◆ _renderPiePlotArea()
|
private |
Definition at line 251 of file jpgraph.php.
References _renderTitle().
Referenced by _renderPieChart().
Here is the call graph for this function: Here is the caller graph for this function:
◆ _renderPlotBar()
|
private |
Definition at line 329 of file jpgraph.php.
References _formatDataSetLabels(), _percentageAdjustValues(), and _percentageSumCalculation().
Referenced by _renderBarChart(), and _renderCombinationChart().
Here is the call graph for this function: Here is the caller graph for this function:
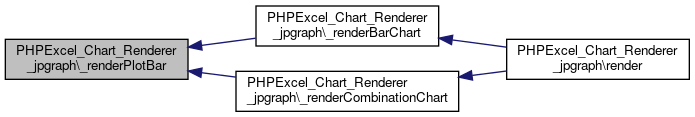
◆ _renderPlotContour()
|
private |
Definition at line 497 of file jpgraph.php.
Referenced by _renderContourChart().
Here is the caller graph for this function:
◆ _renderPlotLine()
|
private |
Definition at line 266 of file jpgraph.php.
References _formatDataSetLabels(), _formatPointMarker(), _percentageAdjustValues(), and _percentageSumCalculation().
Referenced by _renderAreaChart(), _renderCombinationChart(), and _renderLineChart().
Here is the call graph for this function: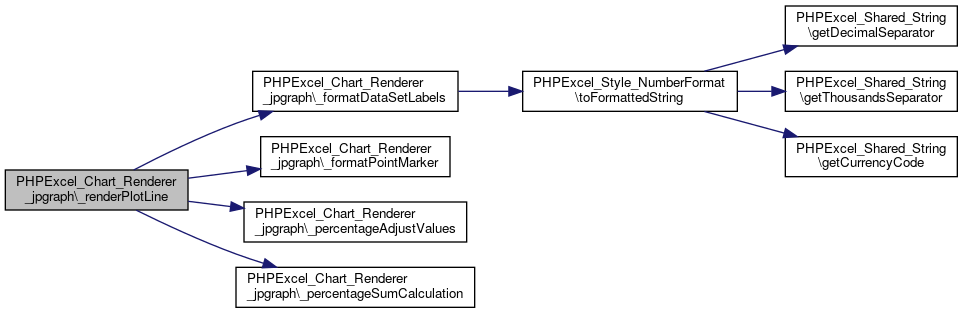 Here is the caller graph for this function:
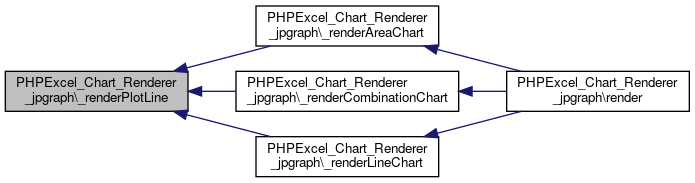
◆ _renderPlotRadar()
|
private |
Definition at line 459 of file jpgraph.php.
References _formatPointMarker().
Referenced by _renderRadarChart().
Here is the call graph for this function: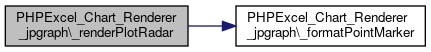 Here is the caller graph for this function:
◆ _renderPlotScatter()
|
private |
Definition at line 414 of file jpgraph.php.
References _formatPointMarker().
Referenced by _renderBubbleChart(), _renderCombinationChart(), and _renderScatterChart().
Here is the call graph for this function: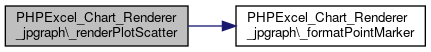 Here is the caller graph for this function:
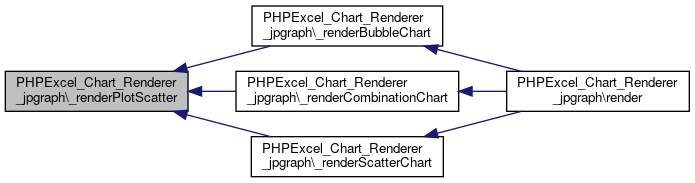
◆ _renderPlotStock()
|
private |
Definition at line 517 of file jpgraph.php.
References _formatDataSetLabels().
Referenced by _renderStockChart().
Here is the call graph for this function: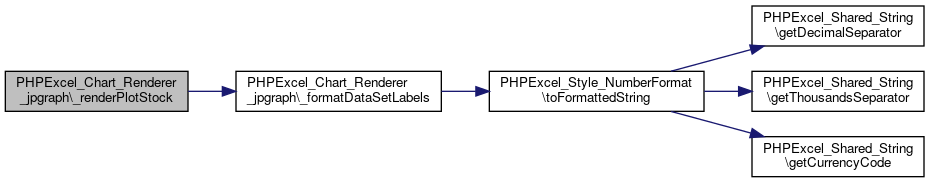 Here is the caller graph for this function:
◆ _renderRadarChart()
|
private |
Definition at line 688 of file jpgraph.php.
References _renderPlotRadar(), _renderRadarPlotArea(), and PHPExcel_Settings\getChartRendererPath().
Referenced by render().
Here is the call graph for this function: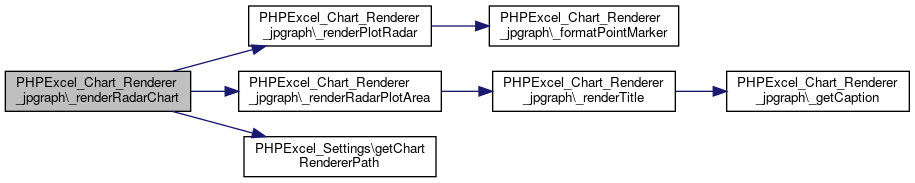 Here is the caller graph for this function:
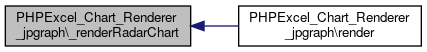
◆ _renderRadarPlotArea()
|
private |
Definition at line 258 of file jpgraph.php.
References _renderTitle().
Referenced by _renderRadarChart().
Here is the call graph for this function: Here is the caller graph for this function:
◆ _renderScatterChart()
|
private |
Definition at line 589 of file jpgraph.php.
References _renderCartesianPlotArea(), _renderPlotScatter(), and PHPExcel_Settings\getChartRendererPath().
Referenced by render().
Here is the call graph for this function: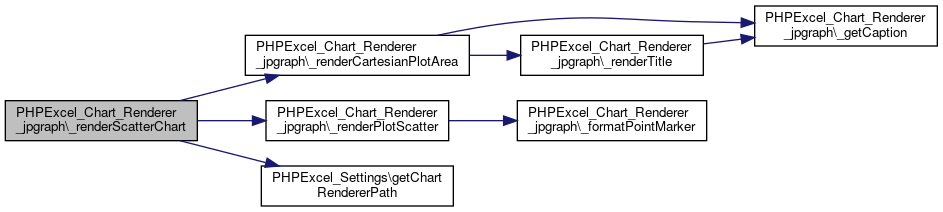 Here is the caller graph for this function:
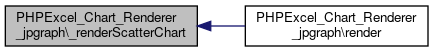
◆ _renderStockChart()
|
private |
Definition at line 699 of file jpgraph.php.
References _renderCartesianPlotArea(), _renderPlotStock(), and PHPExcel_Settings\getChartRendererPath().
Referenced by render().
Here is the call graph for this function: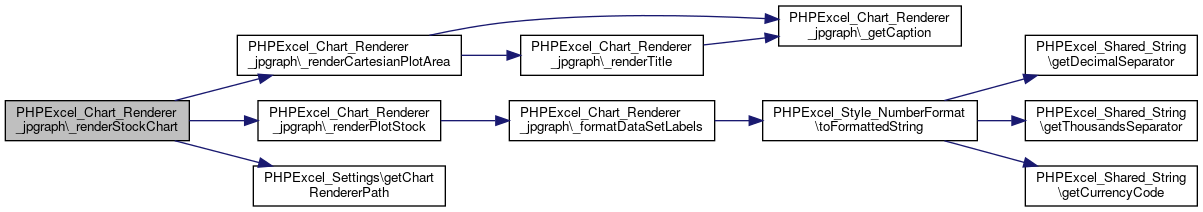 Here is the caller graph for this function:
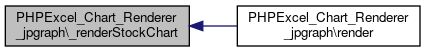
◆ _renderTitle()
|
private |
Definition at line 175 of file jpgraph.php.
References $title, and _getCaption().
Referenced by _renderCartesianPlotArea(), _renderPiePlotArea(), and _renderRadarPlotArea().
Here is the call graph for this function: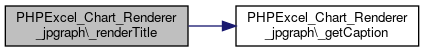 Here is the caller graph for this function:
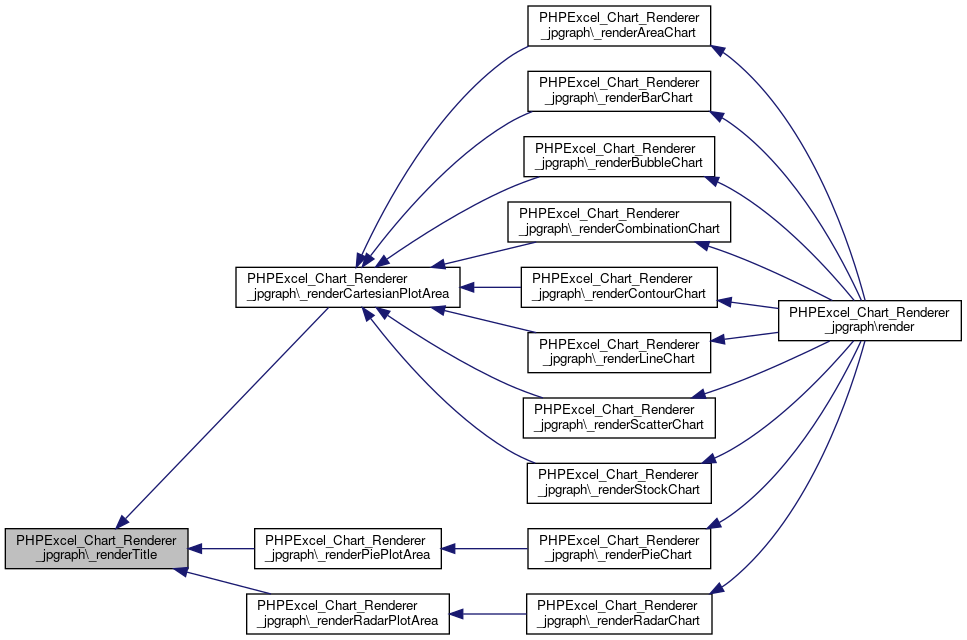
◆ render()
| PHPExcel_Chart_Renderer_jpgraph::render | ( | $outputDestination | ) |
Definition at line 768 of file jpgraph.php.
References _renderAreaChart(), _renderBarChart(), _renderBubbleChart(), _renderCombinationChart(), _renderContourChart(), _renderLegend(), _renderLineChart(), _renderPieChart(), _renderRadarChart(), _renderScatterChart(), and _renderStockChart().
Here is the call graph for this function: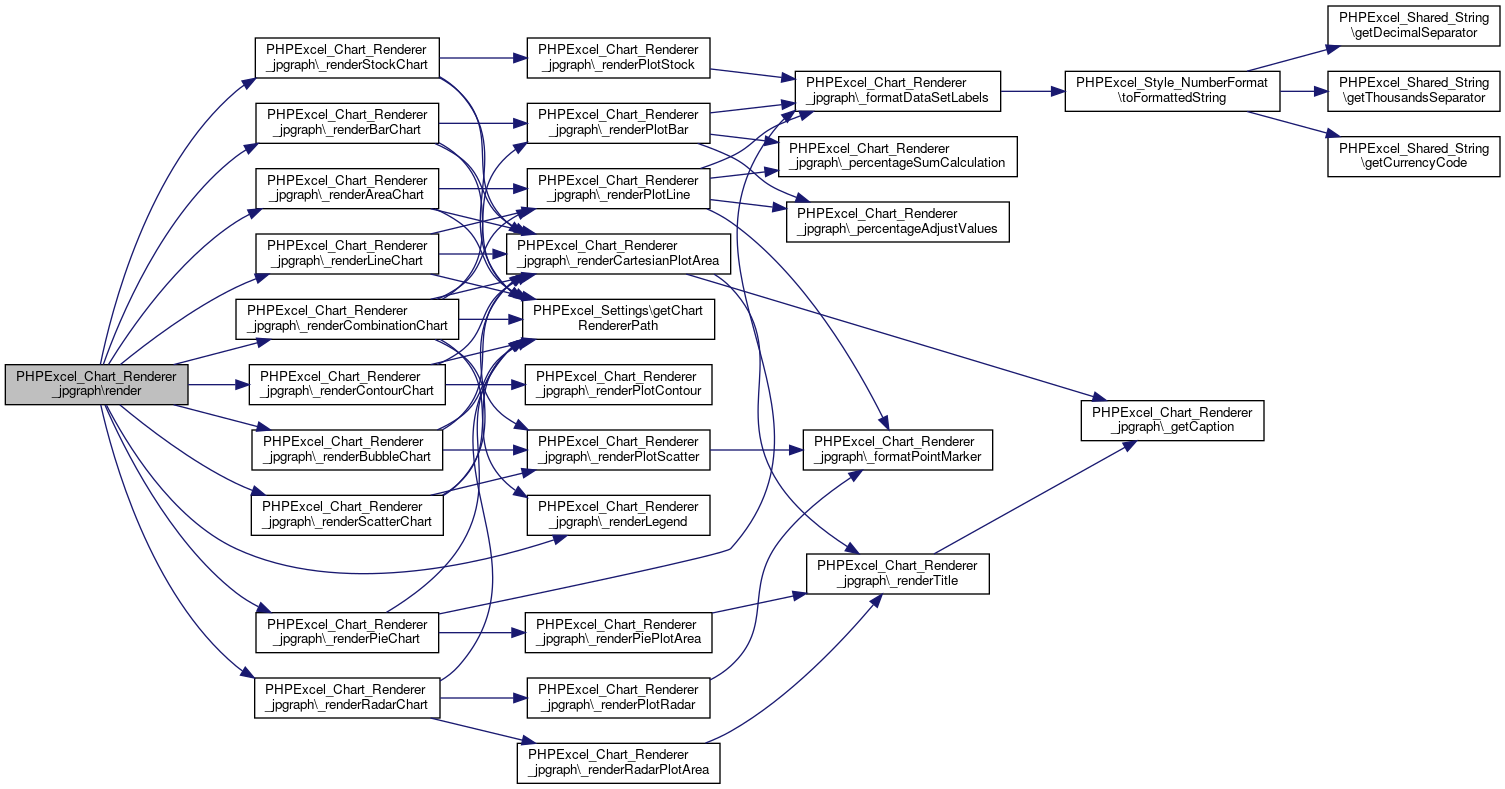
Field Documentation
◆ $_chart
|
private |
Definition at line 65 of file jpgraph.php.
◆ $_colourSet
|
staticprivate |
Definition at line 46 of file jpgraph.php.
◆ $_graph
|
private |
Definition at line 67 of file jpgraph.php.
◆ $_height
|
staticprivate |
Definition at line 44 of file jpgraph.php.
◆ $_markSet
|
staticprivate |
Definition at line 53 of file jpgraph.php.
◆ $_plotColour
|
staticprivate |
Definition at line 69 of file jpgraph.php.
◆ $_plotMark
|
staticprivate |
Definition at line 71 of file jpgraph.php.
◆ $_width
|
staticprivate |
Definition at line 42 of file jpgraph.php.
The documentation for this class was generated from the following file:
- libs/composer/vendor/phpoffice/phpexcel/Classes/PHPExcel/Chart/Renderer/jpgraph.php
