Collaboration diagram for sspmod_statistics_Graph_GoogleCharts:
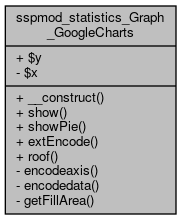
Public Member Functions | |
| __construct ($x=800, $y=350) | |
| Constructor. More... | |
| show ($axis, $axispos, $datasets, $maxes) | |
| Generate a Google Charts URL which points to a generated image. More... | |
| showPie ($axis, $datasets) | |
Static Public Member Functions | |
| static | extEncode ($values) |
| static | roof ($max) |
| Takes a input value, and generates a value that suits better as a max value on the Y-axis. More... | |
Private Member Functions | |
| encodeaxis ($axis) | |
| encodedata ($datasets) | |
| getFillArea ($datasets) | |
| Return colors between multiple graphs... More... | |
Private Attributes | |
| $x | |
| $y | |
Detailed Description
Definition at line 9 of file GoogleCharts.php.
Constructor & Destructor Documentation
◆ __construct()
| sspmod_statistics_Graph_GoogleCharts::__construct | ( | $x = 800, |
|
$y = 350 |
|||
| ) |
Constructor.
Takes dimension of graph as parameters. X and Y.
- Parameters
-
$x X dimension. Default 800. $y Y dimension. Default 350.
Definition at line 21 of file GoogleCharts.php.
Member Function Documentation
◆ encodeaxis()
|
private |
Definition at line 27 of file GoogleCharts.php.
References $axis.
Referenced by show(), and showPie().
Here is the caller graph for this function: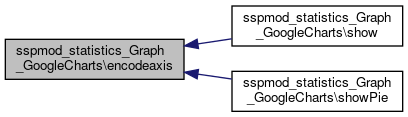
◆ encodedata()
|
private |
Definition at line 33 of file GoogleCharts.php.
References $dataset, $datasets, and extEncode().
Referenced by show(), and showPie().
Here is the call graph for this function: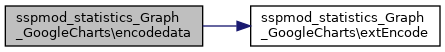 Here is the caller graph for this function:
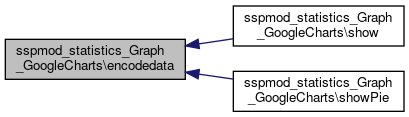
◆ extEncode()
|
static |
Definition at line 42 of file GoogleCharts.php.
References $size.
Referenced by encodedata().
Here is the caller graph for this function: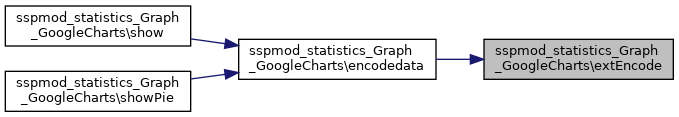
◆ getFillArea()
|
private |
Return colors between multiple graphs...
Definition at line 64 of file GoogleCharts.php.
◆ roof()
|
static |
Takes a input value, and generates a value that suits better as a max value on the Y-axis.
In example 37.6 will not make a good max value, instead it will return 40. It will always return an equal or larger number than it gets as input.
Here is some test code: $foo = array(0, 2, 2.3, 2.6, 6, 10, 15, 98, 198, 256, 487, 563, 763, 801, 899, 999, 987, 198234.485, 283746); foreach ($foo AS $f) { echo '
' . $f . ' => ' . sspmod_statistics_Graph_GoogleCharts::roof($f); }
- Parameters
-
$max Input value.
Definition at line 154 of file GoogleCharts.php.
References $t.
Referenced by sspmod_statistics_StatDataset\calculateMax().
Here is the caller graph for this function: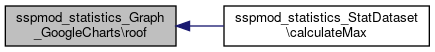
◆ show()
| sspmod_statistics_Graph_GoogleCharts::show | ( | $axis, | |
| $axispos, | |||
| $datasets, | |||
| $maxes | |||
| ) |
Generate a Google Charts URL which points to a generated image.
More documentation on Google Charts here: http://code.google.com/apis/chart/
- Parameters
-
$axis Axis $axpis Axis positions $datasets Datasets values $max Max value. Will be the topmost value on the Y-axis.
Definition at line 89 of file GoogleCharts.php.
References $axis, $datasets, $maxes, $url, encodeaxis(), and encodedata().
Here is the call graph for this function: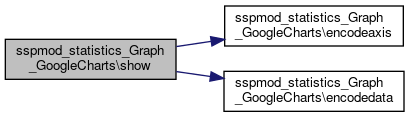
◆ showPie()
| sspmod_statistics_Graph_GoogleCharts::showPie | ( | $axis, | |
| $datasets | |||
| ) |
Definition at line 120 of file GoogleCharts.php.
References $axis, $datasets, $url, encodeaxis(), and encodedata().
Here is the call graph for this function:
Field Documentation
◆ $x
|
private |
Definition at line 11 of file GoogleCharts.php.
Referenced by __construct().
◆ $y
|
private |
Definition at line 11 of file GoogleCharts.php.
Referenced by __construct().
The documentation for this class was generated from the following file:
- libs/composer/vendor/simplesamlphp/simplesamlphp/modules/statistics/lib/Graph/GoogleCharts.php