 Inheritance diagram for PHPlot_Data:
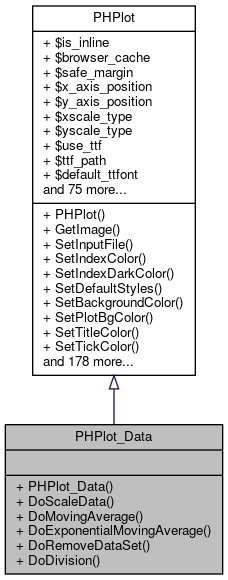 Collaboration diagram for PHPlot_Data:
Public Member Functions | |
| PHPlot_Data ($which_width=600, $which_height=400, $which_output_file=NULL, $which_input_file=NULL) | |
| DoScaleData ($even, $show_in_legend) | |
| DoMovingAverage ($datarow, $interval, $show=TRUE, $color=NULL, $width=NULL) | |
| DoExponentialMovingAverage ($datarow, $perc, $show_in_legend) | |
| Computes an exponentially smoothed moving average. More... | |
| DoRemoveDataSet ($index) | |
| DoDivision ($x, $y) | |
| Public Member Functions inherited from PHPlot | |
| PHPlot ($which_width=600, $which_height=400, $which_output_file=NULL, $which_input_file=NULL) | |
| GetImage ($image_filename, &$width, &$height) | |
| SetInputFile ($which_input_file) | |
| SetIndexColor ($which_color) | |
| SetIndexDarkColor ($which_color) | |
| SetDefaultStyles () | |
| SetBackgroundColor ($which_color) | |
| SetPlotBgColor ($which_color) | |
| SetTitleColor ($which_color) | |
| SetTickColor ($which_color) | |
| SetLabelColor ($which_color) | |
| SetTextColor ($which_color) | |
| SetLightGridColor ($which_color) | |
| SetGridColor ($which_color) | |
| SetImageBorderColor ($which_color) | |
| SetTransparentColor ($which_color) | |
| SetRGBArray ($which_color_array) | |
| SetRGBColor ($color_asked) | |
| SetDataColors ($which_data=NULL, $which_border=NULL) | |
| SetDataBorderColors ($which_br=NULL) | |
| SetErrorBarColors ($which_err=NULL) | |
| SetDefaultDashedStyle ($which_style) | |
| SetDashedStyle ($which_ndxcol) | |
| SetLineWidths ($which_lw=NULL) | |
| SetLineStyles ($which_ls=NULL) | |
| SetLineSpacing ($which_spc) | |
| SetUseTTF ($which_ttf) | |
| SetTTFPath ($which_path) | |
| SetDefaultTTFont ($which_font) | |
| SetDefaultFonts () | |
| SetFont ($which_elem, $which_font, $which_size=12) | |
| ProcessTextGD ($draw_it, $font_number, $font_width, $font_height, $angle, $x, $y, $color, $text, $h_factor, $v_factor) | |
| ProcessTextTTF ($draw_it, $font_file, $font_size, $angle, $x, $y, $color, $text, $h_factor, $v_factor) | |
| ProcessText ($draw_it, $font, $angle, $x, $y, $color, $text, $halign, $valign) | |
| DrawText ($which_font, $which_angle, $which_xpos, $which_ypos, $which_color, $which_text, $which_halign='left', $which_valign='bottom') | |
| SizeText ($which_font, $which_angle, $which_text) | |
| SetFileFormat ($format) | |
| SetBgImage ($input_file, $mode='centeredtile') | |
| SetPlotAreaBgImage ($input_file, $mode='tile') | |
| SetOutputFile ($which_output_file) | |
| SetIsInline ($which_ii) | |
| PrintImage () | |
| PrintError ($error_message) | |
| DrawError ($error_message, $where_x=NULL, $where_y=NULL) | |
| SetXDataLabelPos ($which_xdlp) | |
| SetYDataLabelPos ($which_ydlp, $which_distance_from_point=0) | |
| SetXTickLabelPos ($which_xtlp) | |
| SetYTickLabelPos ($which_ytlp) | |
| SetXLabelType ($which_xlt) | |
| SetYLabelType ($which_ylt) | |
| SetXTimeFormat ($which_xtf) | |
| SetYTimeFormat ($which_ytf) | |
| SetNumberFormat ($decimal_point, $thousands_sep) | |
| SetXLabelAngle ($which_xla) | |
| SetYLabelAngle ($which_yla) | |
| CheckOption ($which_opt, $which_acc, $which_func) | |
| SetBrowserCache ($which_browser_cache) | |
| SetPrintImage ($which_pi) | |
| SetLegend ($which_leg) | |
| SetLegendPixels ($which_x, $which_y) | |
| SetLegendWorld ($which_x, $which_y) | |
| SetLegendStyle ($text_align, $colorbox_align='', $style='') | |
| SetPlotBorderType ($pbt) | |
| SetImageBorderType ($sibt) | |
| SetDrawPlotAreaBackground ($dpab) | |
| SetDrawYGrid ($dyg) | |
| SetDrawXGrid ($dxg) | |
| SetDrawDashedGrid ($ddg) | |
| SetDrawXDataLabelLines ($dxdl) | |
| SetDrawYDataLabelLines ($dydl) | |
| SetTitle ($which_title) | |
| SetXTitle ($which_xtitle, $which_xpos='plotdown') | |
| SetYTitle ($which_ytitle, $which_ypos='plotleft') | |
| SetShading ($which_s) | |
| SetPlotType ($which_pt) | |
| SetYAxisPosition ($pos) | |
| SetXAxisPosition ($pos) | |
| SetXScaleType ($which_xst) | |
| SetYScaleType ($which_yst) | |
| SetPrecisionX ($which_prec) | |
| SetPrecisionY ($which_prec) | |
| SetErrorBarLineWidth ($which_seblw) | |
| SetLabelScalePosition ($which_blp) | |
| SetErrorBarSize ($which_ebs) | |
| SetErrorBarShape ($which_ebs) | |
| SetPointShapes ($which_pt) | |
| SetPointSizes ($which_ps) | |
| SetDrawBrokenLines ($bl) | |
| SetDataType ($which_dt) | |
| SetDataValues (&$which_dv) | |
| PadArrays () | |
| pad_array (&$arr, $size) | |
| number_format ($number, $decimals=0) | |
| SetCallback ($reason, $function, $arg=NULL) | |
| GetCallback ($reason) | |
| RemoveCallback ($reason) | |
| DoCallback () # Note | |
| FindDataLimits () | |
| CalcMargins ($maximize) | |
| CalcPlotAreaPixels () | |
| SetMarginsPixels ($which_lm, $which_rm, $which_tm, $which_bm) | |
| SetPlotAreaPixels ($x1, $y1, $x2, $y2) | |
| CalcPlotAreaWorld () | |
| SetPlotAreaWorld ($xmin=NULL, $ymin=NULL, $xmax=NULL, $ymax=NULL) | |
| CalcBarWidths () | |
| CalcAxisPositions () | |
| CalcTranslation () | |
| xtr ($x_world) | |
| ytr ($y_world) | |
| CalcTicks ($which) | |
| CalcMaxTickLabelSize ($which) | |
| CalcMaxDataLabelSize () | |
| FormatLabel ($which_pos, $which_lab) | |
| SetXTickIncrement ($which_ti='') | |
| SetYTickIncrement ($which_ti='') | |
| SetNumXTicks ($which_nt) | |
| SetNumYTicks ($which_nt) | |
| SetYTickPos ($which_tp) | |
| SetXTickPos ($which_tp) | |
| SetSkipTopTick ($skip) | |
| SetSkipBottomTick ($skip) | |
| SetSkipLeftTick ($skip) | |
| SetSkipRightTick ($skip) | |
| SetXTickLength ($which_xln) | |
| SetYTickLength ($which_yln) | |
| SetXTickCrossing ($which_xc) | |
| SetYTickCrossing ($which_yc) | |
| DrawBackground () | |
| DrawPlotAreaBackground () | |
| tile_img ($file, $xorig, $yorig, $width, $height, $mode) | |
| DrawImageBorder () | |
| DrawTitle () | |
| DrawXTitle () | |
| DrawYTitle () | |
| DrawYAxis () | |
| DrawXAxis () | |
| DrawYTick ($which_ylab, $which_ypix) | |
| DrawYTicks () | |
| DrawXTick ($which_xlab, $which_xpix) | |
| DrawXTicks () | |
| DrawPlotBorder () | |
| DrawDataLabel ($which_font, $which_angle, $x_world, $y_world, $which_color, $which_text, $which_halign='center', $which_valign='bottom', $x_adjustment=0, $y_adjustment=0) | |
| DrawXDataLabel ($xlab, $xpos, $row=FALSE) | |
| DrawXDataLine ($xpos, $row) | |
| DrawLegend () | |
| DrawAxisLegend () | |
| DrawPieChart () | |
| DrawDotsError () | |
| DrawDots () | |
| DrawThinBarLines () | |
| DrawYErrorBar ($x_world, $y_world, $error_height, $error_bar_type, $color) | |
| DrawDot ($x_world, $y_world, $record, $color) | |
| DrawArea () | |
| DrawLines () | |
| DrawLinesError () | |
| DrawSquared () | |
| DrawBars () | |
| DrawStackedBars () | |
| DrawGraph () | |
| SetDrawVertTicks ($which_dvt) | |
| SetDrawHorizTicks ($which_dht) | |
| SetNumHorizTicks ($n) | |
| SetNumVertTicks ($n) | |
| SetHorizTickIncrement ($inc) | |
| SetVertTickIncrement ($inc) | |
| SetVertTickPosition ($which_tp) | |
| SetHorizTickPosition ($which_tp) | |
| SetTitleFontSize ($which_size) | |
| SetAxisFontSize ($which_size) | |
| SetSmallFontSize ($which_size) | |
| SetXLabelFontSize ($which_size) | |
| SetYLabelFontSize ($which_size) | |
| SetXLabel ($which_xlab) | |
| SetYLabel ($which_ylab) | |
| SetTickLength ($which_tl) | |
| SetYGridLabelType ($which_yglt) | |
| SetXGridLabelType ($which_xglt) | |
| SetYGridLabelPos ($which_yglp) | |
| SetXGridLabelPos ($which_xglp) | |
| SetXTitlePos ($xpos) | |
| SetYTitlePos ($xpos) | |
| SetXDataLabelAngle ($which_xdla) | |
| SetDrawXDataLabels ($which_dxdl) | |
| SetNewPlotAreaPixels ($x1, $y1, $x2, $y2) | |
| SetColor ($which_color) | |
| SetLineWidth ($which_lw) | |
| SetPointShape ($which_pt) | |
| SetPointSize ($which_ps) | |
Detailed Description
Definition at line 18 of file phplot_data.php.
Member Function Documentation
◆ DoDivision()
| PHPlot_Data::DoDivision | ( | $x, | |
| $y | |||
| ) |
Computes row x divided by row y, stores the result in row x and deletes row y
Definition at line 234 of file phplot_data.php.
References DoRemoveDataSet(), and PHPlot\DrawError().
Here is the call graph for this function: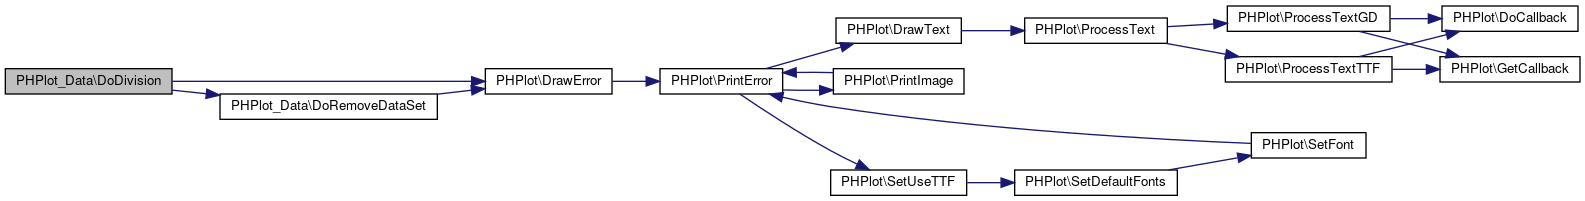
◆ DoExponentialMovingAverage()
| PHPlot_Data::DoExponentialMovingAverage | ( | $datarow, | |
| $perc, | |||
| $show_in_legend | |||
| ) |
Computes an exponentially smoothed moving average.
- Parameters
-
int perc "smoothing percentage" FIXME!!! I haven't checked this.
Definition at line 178 of file phplot_data.php.
References PHPlot\DrawError().
Here is the call graph for this function: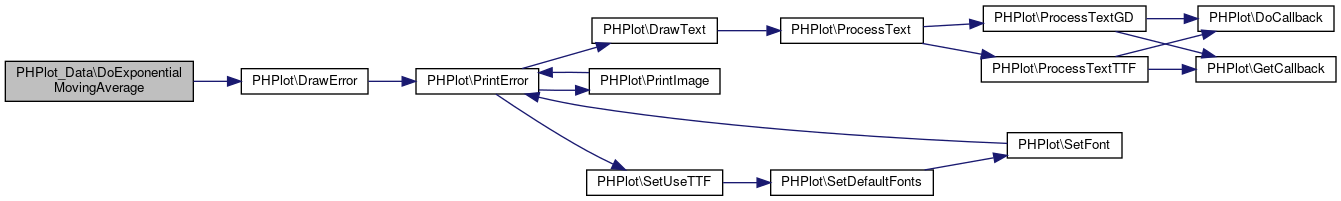
◆ DoMovingAverage()
| PHPlot_Data::DoMovingAverage | ( | $datarow, | |
| $interval, | |||
$show = TRUE, |
|||
$color = NULL, |
|||
$width = NULL |
|||
| ) |
Computes a moving average of strength $interval for data row number $datarow, where 0 denotes the first row of y-data.
- Parameters
-
int datarow Index of the row whereupon to make calculations int interval Number of elements to use in average ("strength") bool show Whether to tell about the moving average in the legend. string color Color for the line to be drawn. This color is darkened. Can be named or #RRGGBB. int width Width of the line to be drawn.
- Note
- Original idea by Theimo Nagel
Definition at line 117 of file phplot_data.php.
References PHPlot\DrawError(), PHPlot\PadArrays(), and PHPlot\SetIndexDarkColor().
Here is the call graph for this function: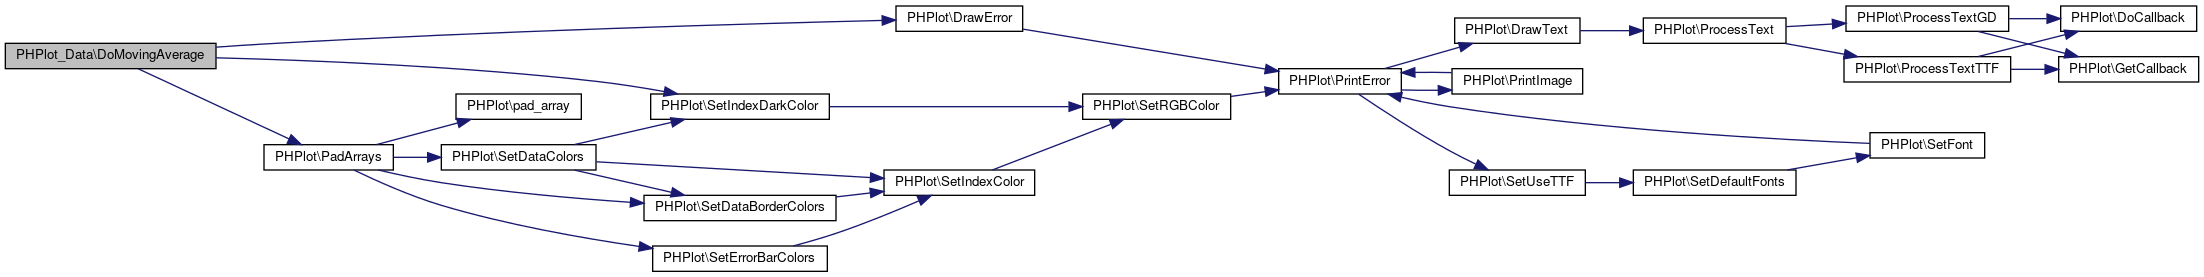
◆ DoRemoveDataSet()
| PHPlot_Data::DoRemoveDataSet | ( | $index | ) |
Removes the DataSet of number $index
Definition at line 205 of file phplot_data.php.
References PHPlot\DrawError().
Referenced by DoDivision().
Here is the call graph for this function: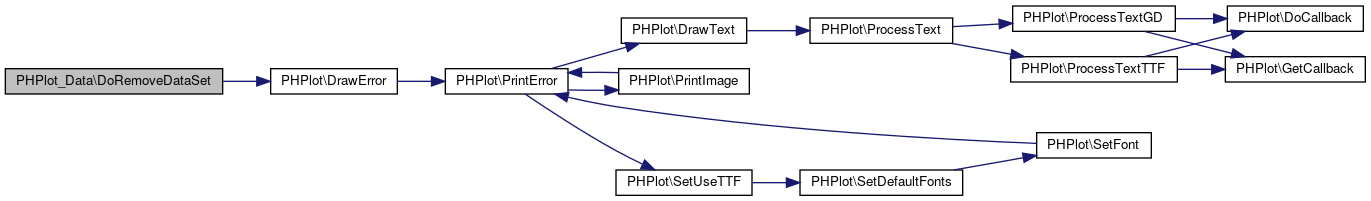 Here is the caller graph for this function:
◆ DoScaleData()
| PHPlot_Data::DoScaleData | ( | $even, | |
| $show_in_legend | |||
| ) |
Will scale all data rows Maybe later I will do a function that only scales some rows if $even is TRUE, data will be scaled with "even" factors.
- Note
- Original code by Thiemo Nagel
Definition at line 36 of file phplot_data.php.
References PHPlot\DrawError(), and PHPlot\SetYTickIncrement().
Here is the call graph for this function: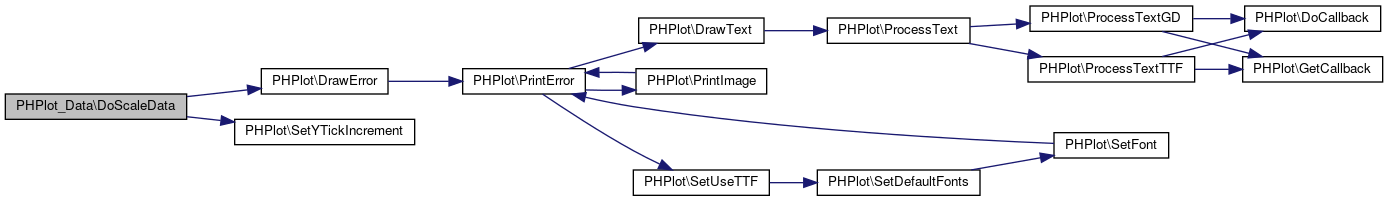
◆ PHPlot_Data()
| PHPlot_Data::PHPlot_Data | ( | $which_width = 600, |
|
$which_height = 400, |
|||
$which_output_file = NULL, |
|||
$which_input_file = NULL |
|||
| ) |
Constructor
Definition at line 23 of file phplot_data.php.
References PHPlot\PHPlot().
Here is the call graph for this function: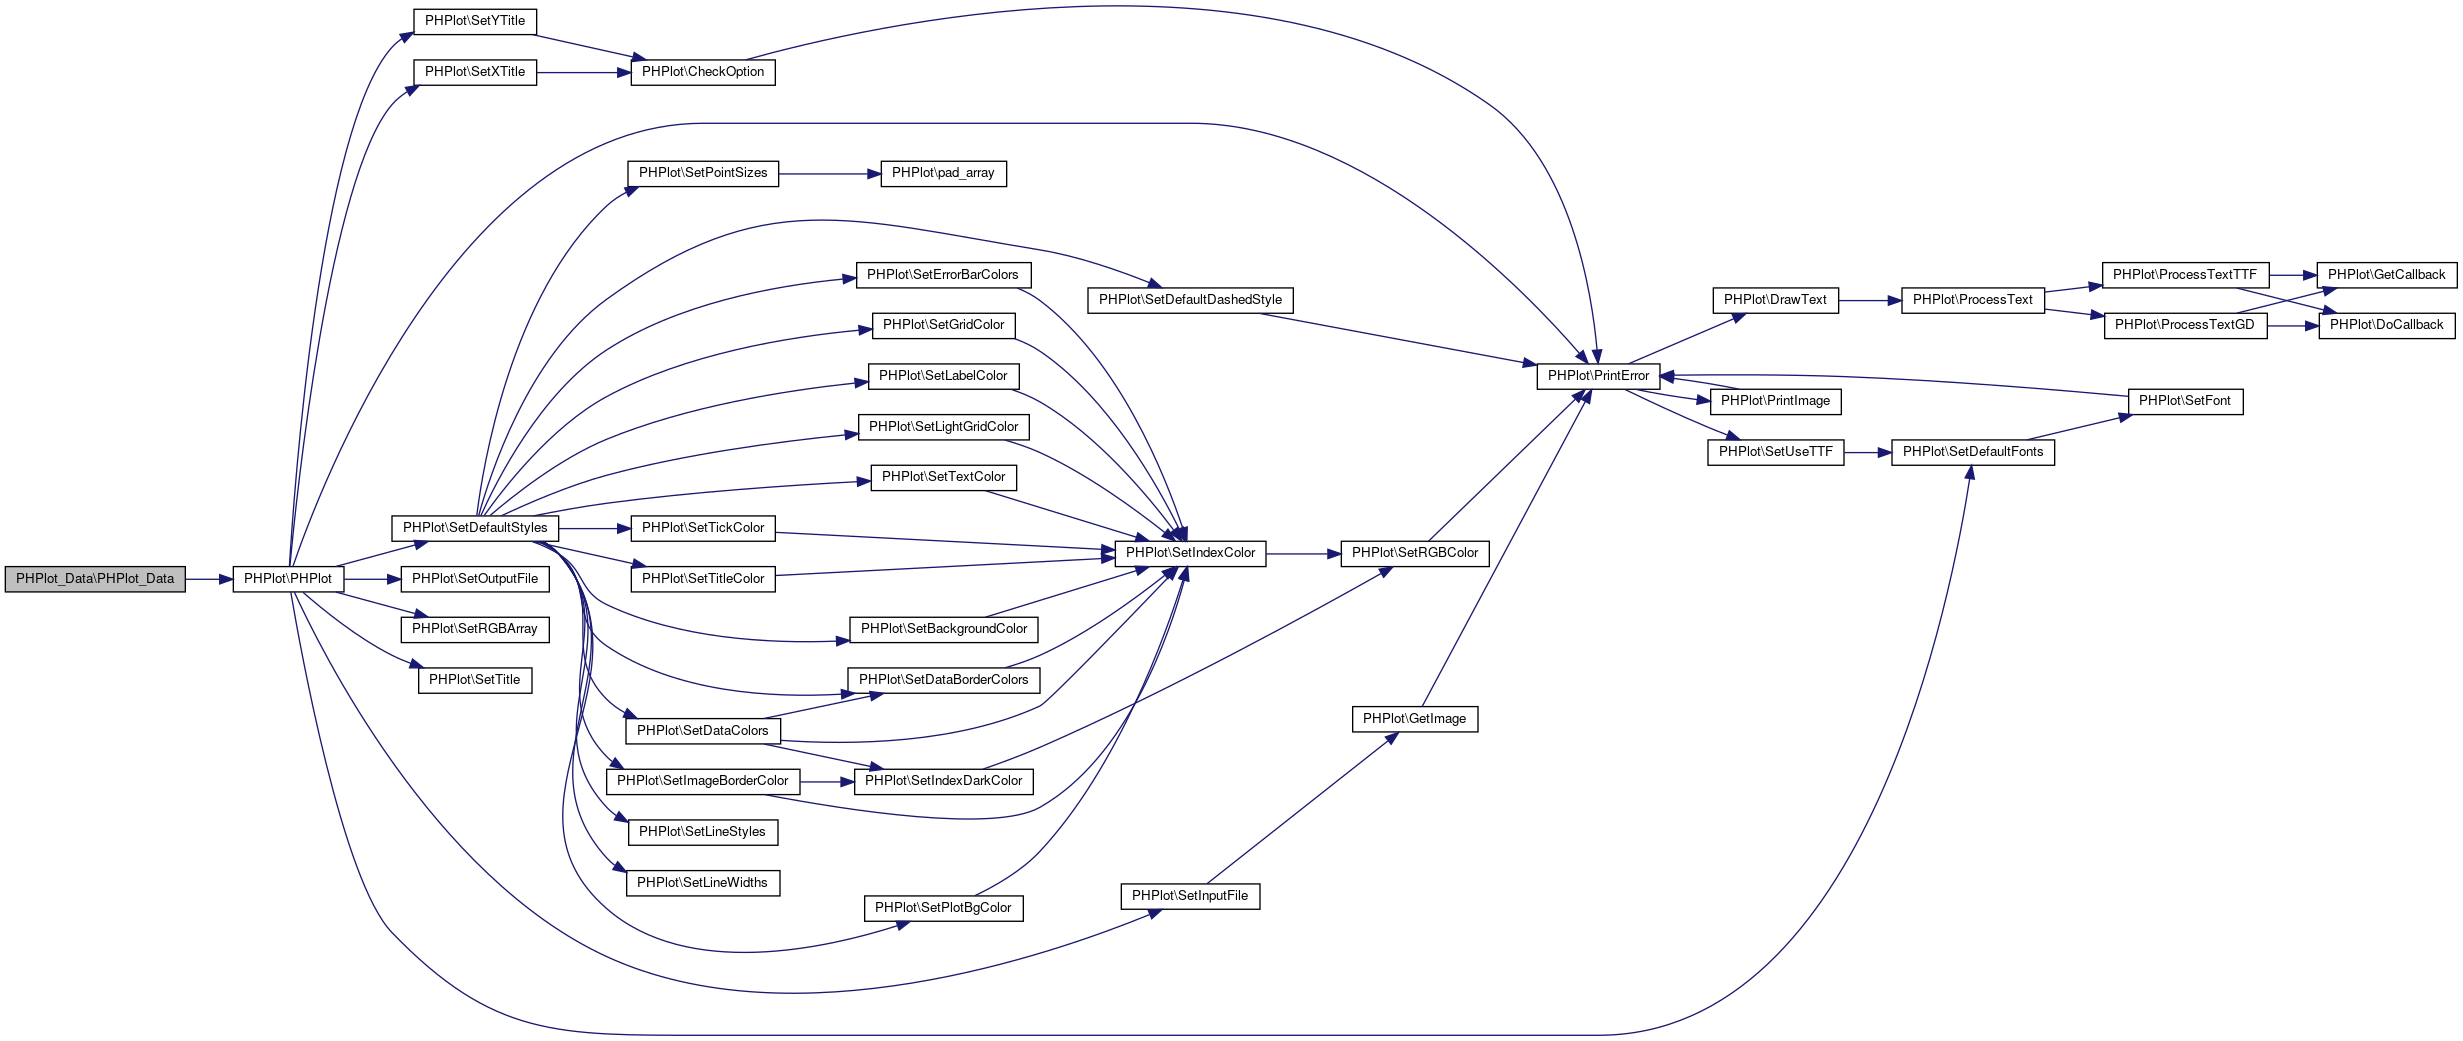
The documentation for this class was generated from the following file:
- Modules/SurveyQuestionPool/phplot/phplot_data.php
