Chart generator. More...
 Collaboration diagram for ilChart:
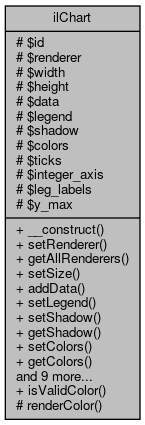
Public Member Functions | |
| __construct ($a_id, $a_width=500, $a_height=500, $a_renderer="flot") | |
| Constructor. More... | |
| setRenderer ($a_value) | |
| Set renderer. More... | |
| getAllRenderers () | |
| Get all available renderers. More... | |
| setSize ($a_x, $a_y) | |
| Set chart size. More... | |
| addData (ilChartData $a_series, $a_idx=null) | |
| Add data series. More... | |
| setLegend (ilChartLegend $a_legend) | |
| Set chart legend. More... | |
| setShadow ($a_value) | |
| Set shadow. More... | |
| getShadow () | |
| Get shadow. More... | |
| setColors ($a_values) | |
| Set colors. More... | |
| getColors () | |
| Get colors. More... | |
| setTicks ($a_x, $a_y, $a_labeled=false) | |
| Set ticks. More... | |
| getTicks () | |
| Get ticks. More... | |
| setLegLabels ($a_val) | |
| Set leg labels. More... | |
| getLegLabels () | |
| Get leg labels. More... | |
| getHTML () | |
| Render (flot only currently) More... | |
| setYAxisToInteger ($a_status) | |
| setXAxisToInteger ($a_status) | |
| setYAxisMax ($a_val) | |
| Set y axis max value. More... | |
| getYAxisMax () | |
| Get y axis max value. More... | |
Static Public Member Functions | |
| static | isValidColor ($a_value) |
| Validate html color code. More... | |
Static Protected Member Functions | |
| static | renderColor ($a_value, $a_opacity=1) |
| Render html color code. More... | |
Protected Attributes | |
| $id | |
| $renderer | |
| $width | |
| $height | |
| $data | |
| $legend | |
| $shadow | |
| $colors | |
| $ticks | |
| $integer_axis | |
| $leg_labels = array() | |
| $y_max = 0 | |
Detailed Description
Constructor & Destructor Documentation
◆ __construct()
| ilChart::__construct | ( | $a_id, | |
$a_width = 500, |
|||
$a_height = 500, |
|||
$a_renderer = "flot" |
|||
| ) |
Constructor.
- Parameters
-
string $a_id int $a_width int $a_height string $a_renderer
Definition at line 37 of file class.ilChart.php.
References setRenderer(), setShadow(), setSize(), setXAxisToInteger(), and setYAxisToInteger().
Here is the call graph for this function: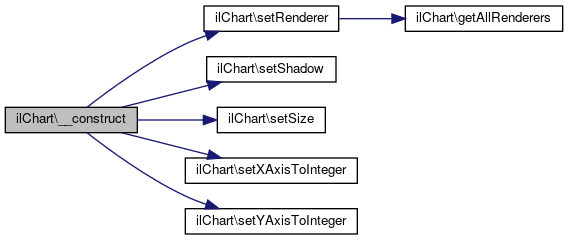
Member Function Documentation
◆ addData()
| ilChart::addData | ( | ilChartData | $a_series, |
$a_idx = null |
|||
| ) |
Add data series.
- Parameters
-
ilChartData $a_series mixed $a_id
- Returns
- mixed index
Definition at line 90 of file class.ilChart.php.
References $data.
◆ getAllRenderers()
| ilChart::getAllRenderers | ( | ) |
Get all available renderers.
- Returns
- array
Definition at line 66 of file class.ilChart.php.
Referenced by setRenderer().
Here is the caller graph for this function:
◆ getColors()
| ilChart::getColors | ( | ) |
Get colors.
- Returns
- array
Definition at line 195 of file class.ilChart.php.
References $colors.
Referenced by getHTML().
Here is the caller graph for this function:
◆ getHTML()
| ilChart::getHTML | ( | ) |
Render (flot only currently)
Definition at line 245 of file class.ilChart.php.
References $colors, $legend, $options, $ret, $ticks, $tpl, $width, getColors(), getLegLabels(), getShadow(), getTicks(), getYAxisMax(), iljQueryUtil\initjQuery(), and ilUtil\shortenText().
Here is the call graph for this function: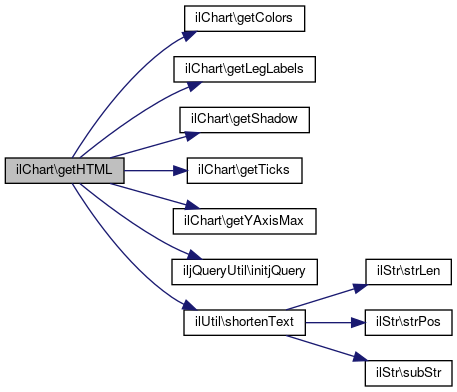
◆ getLegLabels()
| ilChart::getLegLabels | ( | ) |
Get leg labels.
- Returns
- array leg labels (array of strings)
Definition at line 237 of file class.ilChart.php.
References $leg_labels.
Referenced by getHTML().
Here is the caller graph for this function: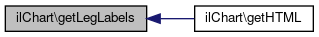
◆ getShadow()
| ilChart::getShadow | ( | ) |
Get shadow.
- Returns
- int
Definition at line 169 of file class.ilChart.php.
References $shadow.
Referenced by getHTML().
Here is the caller graph for this function: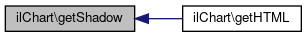
◆ getTicks()
| ilChart::getTicks | ( | ) |
Get ticks.
- Returns
- array (x, y)
Definition at line 217 of file class.ilChart.php.
References $ticks.
Referenced by getHTML().
Here is the caller graph for this function: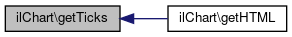
◆ getYAxisMax()
| ilChart::getYAxisMax | ( | ) |
Get y axis max value.
- Returns
- float y axis max value
Definition at line 517 of file class.ilChart.php.
References $y_max.
Referenced by getHTML().
Here is the caller graph for this function:
◆ isValidColor()
|
static |
Validate html color code.
- Parameters
-
string $a_value
- Returns
- bool
Definition at line 116 of file class.ilChart.php.
Referenced by ilChartLegend\setBackground(), ilChartData\setFill(), and ilChartLegend\setLabelBorder().
Here is the caller graph for this function: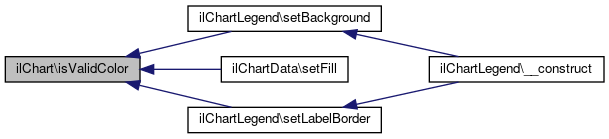
◆ renderColor()
|
staticprotected |
Render html color code.
- Parameters
-
string $a_value float $a_opacity
- Returns
- string
Definition at line 135 of file class.ilChart.php.
◆ setColors()
| ilChart::setColors | ( | $a_values | ) |
◆ setLegend()
| ilChart::setLegend | ( | ilChartLegend | $a_legend | ) |
Set chart legend.
- Parameters
-
ilChartLegend $a_legend
Definition at line 105 of file class.ilChart.php.
◆ setLegLabels()
| ilChart::setLegLabels | ( | $a_val | ) |
Set leg labels.
- Parameters
-
array $a_val leg labels (array of strings)
Definition at line 227 of file class.ilChart.php.
◆ setRenderer()
| ilChart::setRenderer | ( | $a_value | ) |
Set renderer.
- Parameters
-
string $a_value
Definition at line 53 of file class.ilChart.php.
References getAllRenderers().
Referenced by __construct().
Here is the call graph for this function: Here is the caller graph for this function:
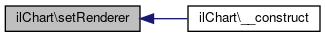
◆ setShadow()
| ilChart::setShadow | ( | $a_value | ) |
Set shadow.
- Parameters
-
int $a_value
Definition at line 159 of file class.ilChart.php.
Referenced by __construct().
Here is the caller graph for this function:
◆ setSize()
| ilChart::setSize | ( | $a_x, | |
| $a_y | |||
| ) |
Set chart size.
- Parameters
-
int $a_x int $a_y
Definition at line 77 of file class.ilChart.php.
Referenced by __construct().
Here is the caller graph for this function:
◆ setTicks()
| ilChart::setTicks | ( | $a_x, | |
| $a_y, | |||
$a_labeled = false |
|||
| ) |
Set ticks.
- Parameters
-
int | array $a_x int | array $a_y bool $a_labeled
Definition at line 207 of file class.ilChart.php.
◆ setXAxisToInteger()
| ilChart::setXAxisToInteger | ( | $a_status | ) |
Definition at line 497 of file class.ilChart.php.
Referenced by __construct().
Here is the caller graph for this function:
◆ setYAxisMax()
| ilChart::setYAxisMax | ( | $a_val | ) |
Set y axis max value.
- Parameters
-
float $a_val y axis max value
Definition at line 507 of file class.ilChart.php.
◆ setYAxisToInteger()
| ilChart::setYAxisToInteger | ( | $a_status | ) |
Definition at line 492 of file class.ilChart.php.
Referenced by __construct().
Here is the caller graph for this function:
Field Documentation
◆ $colors
|
protected |
Definition at line 23 of file class.ilChart.php.
Referenced by getColors(), and getHTML().
◆ $data
|
protected |
Definition at line 20 of file class.ilChart.php.
Referenced by addData().
◆ $height
|
protected |
Definition at line 19 of file class.ilChart.php.
◆ $id
|
protected |
Definition at line 16 of file class.ilChart.php.
◆ $integer_axis
|
protected |
Definition at line 25 of file class.ilChart.php.
◆ $leg_labels
|
protected |
Definition at line 26 of file class.ilChart.php.
Referenced by getLegLabels().
◆ $legend
|
protected |
Definition at line 21 of file class.ilChart.php.
Referenced by getHTML().
◆ $renderer
|
protected |
Definition at line 17 of file class.ilChart.php.
◆ $shadow
|
protected |
Definition at line 22 of file class.ilChart.php.
Referenced by getShadow().
◆ $ticks
|
protected |
Definition at line 24 of file class.ilChart.php.
Referenced by getHTML(), and getTicks().
◆ $width
|
protected |
Definition at line 18 of file class.ilChart.php.
Referenced by getHTML().
◆ $y_max
|
protected |
Definition at line 27 of file class.ilChart.php.
Referenced by getYAxisMax().
The documentation for this class was generated from the following file:
- Services/Chart/classes/class.ilChart.php
